In this project, you will deploy and configure Snort, a leading open-source Network Intrusion Detection System (NIDS), to monitor network traffic for suspicious activity and actions. The objective is to move beyond theoretical knowledge of Intrusion Detection and Prevention System architectures and gain practical experience in packet analysis, rule development, and threat detection within a mixed-OS environment.
Cybrary is a well established and free IT training platform with several intuitive labs to explore
A paid subscription with more advanced labs is available as well outside the scope of this platform
Head to https://www.cybrary.it to create a free account for learning available on their platform
Head to IDS Basics to complete it for yourself or you can perform it on your homelab below
Quick Links:
Requirements:
• Windows PC w/ Internet Connection
• USB Flash Drives w/ at least 64GB Capacity
• 2 Unused PCs w/ at least 4GB of Memory
1. Intrusion Detection Systems Overview
Intrusion Detection Systems (IDS) monitor network traffic or system activities to detect malicious actions
An IDS is a passive system in that it only detects and alerts administrators about threats without actions
There are two types of Intrusion Detection system: the Host-Based IDS (HIDS) and Network-Based IDS (NIDS)
A Host-Based IDS operates on an individual host or device to monitor specific activities indicating attack
These activities can include file changes, failed login attempts, and many system level events or changes
A Network-Based IDS (NIDS) analyzes network traffic to identify suspicious patterns, streams, or packets

Intrusion Prevention Systems (IPS) also monitor network and system traffic to detect malicious activities
However, unlike the IDS, an Intrusion Prevention System can take steps to actively block real-time threats
There are two types of Intrusion Prevention Systems: a Host-Based IPS (HIPS) and Network-Based IPS (NIPS)
While a Network-Based IDS can be placed anywhere in network, an IPS must be placed inline to drop packets
For this reason you'll often find Network-Based IPS systems built into the modern UTM firewall appliances
Both the IDS and IPS analyze traffic or activities for known malicious patterns using signature detection
Both contribute to threat intelligence by generating logs, alerts, and insights into various attack vectors
Both can be made to to utilize machine learning and behavioral analytics to identify sophisticated threats
|
Feature |
Intrusion Detection Systems |
Intrusion Prevention Systems |
|
Functionality |
Detection and Alerting |
Detection and Prevention |
|
Deployment |
Passive |
Inline |
|
Response |
Generates Alerts |
Drops, Blocks, or Mitigates Threats |
|
Impact on Traffic |
No Latency Introduced |
May Introduce Latency Due to Inline Operation |
Both Intrusion Detection and Prevention Systems detect malicious activities by using one of three methods:
• Signature-Based Detection
Relies on a database of known attack signatures. Effective against well-documented known threat vectors
• Anomaly-Based Detection
Uses machine learning or predefined baselines to identify unusual activity. Can detect zero-day threats
• Hybrid Detection
Combines both signature-based and anomaly-based methods for a more comprehensive detection ability set
One of the most popular IDS/IPS solutions is Snort, an open source network-based signature detection IDS
It features a flexible rule-based detection engine, wide community support, and thousands of pre-made rules
Snort can function as an IDS or IPS when used inline. It is also cost effective, and highly customizable
Suricata is another popular Intrusion Detection / Prevention system / Network Security Monitoring system
Suricata supports multi-threading for better performance, and features protocol parsing for deep inspection
The security software boasts superior speed on modern hardware as well as native support for other tools
Both solutions can be installed on stand-alone Linux systems and are integrated into the popular firewalls
They also use the same kind of rules and share many of the same features. This lesson will focus on Snort
|
Feature |
Snort |
Suricata |
|
Performance |
Single-Threaded |
Multi-Threaded |
|
Ease of Use |
Beginner-Friendly |
More Complex Setup |
|
Protocol Support |
Basic |
Deep Protocol Parsing |
|
Community Support |
Established |
Growing Rapidly |
In the next lesson, you will get some hands-on experience with configuring Snort for the OpenBSD system
We will setup the operating system from scratch and review Snorts basic syntax and the operational modes
2. Install FreeBSD
FreeBSD is self described as an operating system used to power modern servers, desktops, and embedded PCs
An important distinction here is that BSD is not Linux, and uses the FreeBSD kernel over the Linux Kernel
It is a versatile and open-source UNIX-like operating system known for its exceptional security features
The Linux kernel was also derived from the UNIX operating system, while not the same they share their roots
FreeBSD is a long established platform for security research with many projects based including pfSense
FreeBSD's robust security features also position it as a strong candidate for use as a security appliance
We will do just that and configure the FreeBSD operating system to act as an Intrusion Detection System
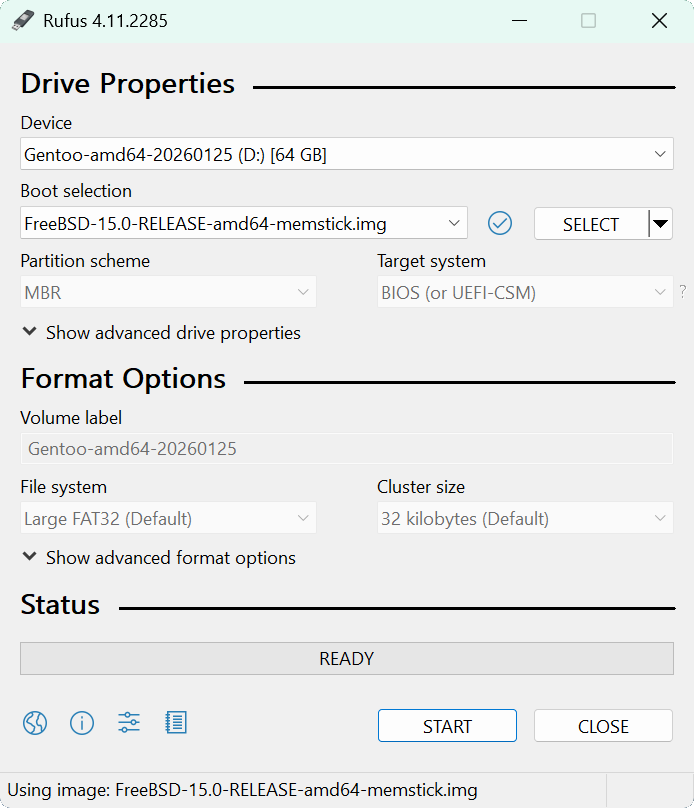
Download FreeBSD AMD64 Iso: FreeBSD Memstick Image
Download Rufus Disk Imaging Software: Rufus Official Download
Insert USB Flash Drive, run rufus.exe, select target drive, select the FreeBSD Image, then click start:
Remove the USB Flash Drive and Insert into unused PC. Start PC and press the hot boot key at the startup:
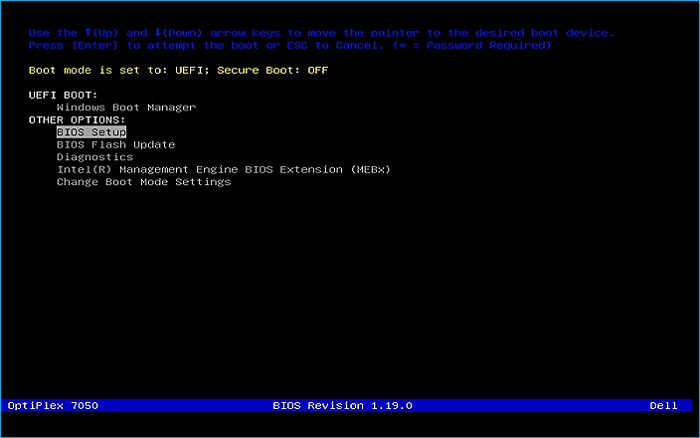
Select the option to boot from your USB Flash Drive, then select the Boot Installer option from below:
Once the installation medium loads the files into memory, you will be presented with the option to install
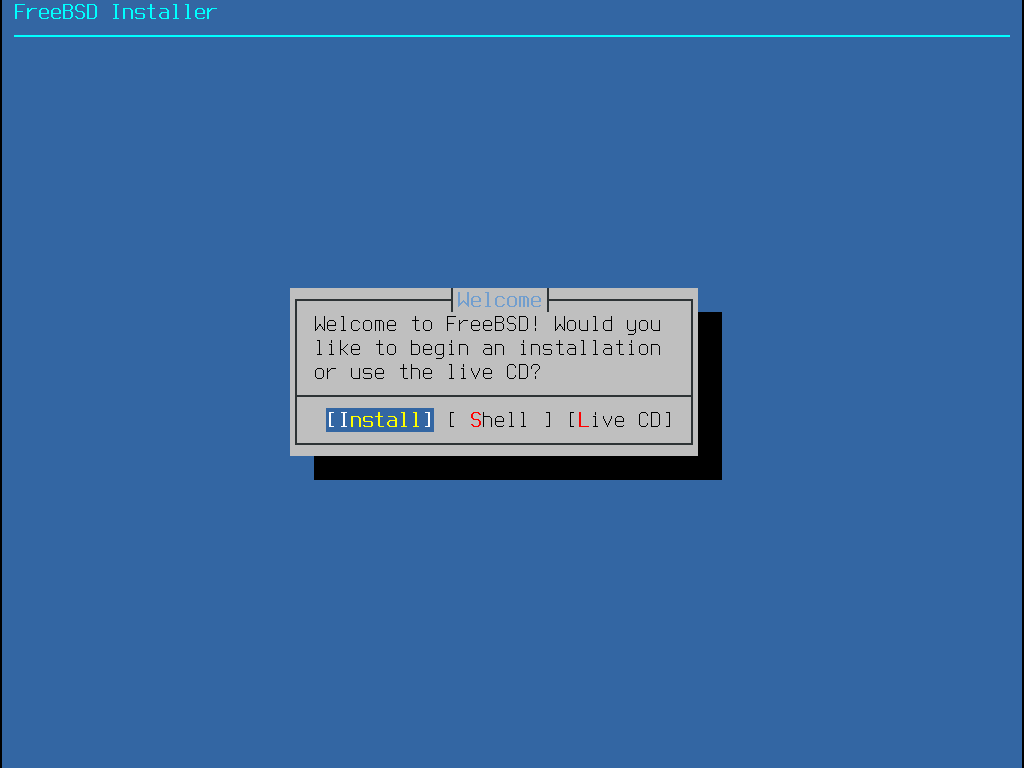
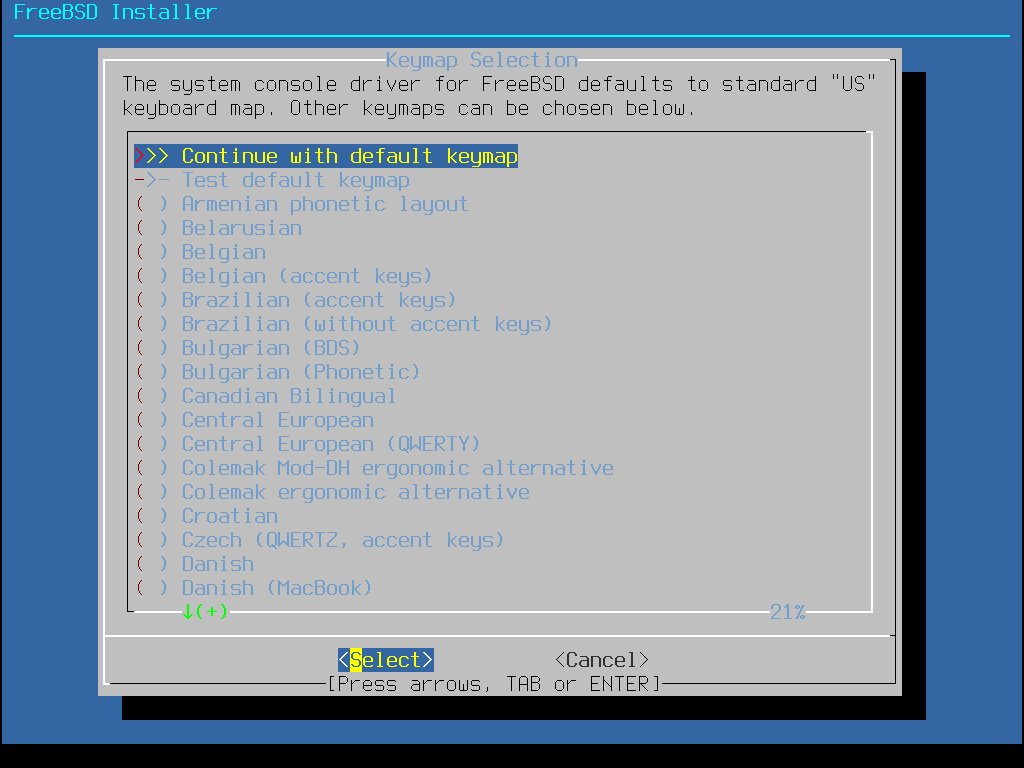
Press the enter key to select the Install option, then press enter again to confirm the default US keymap
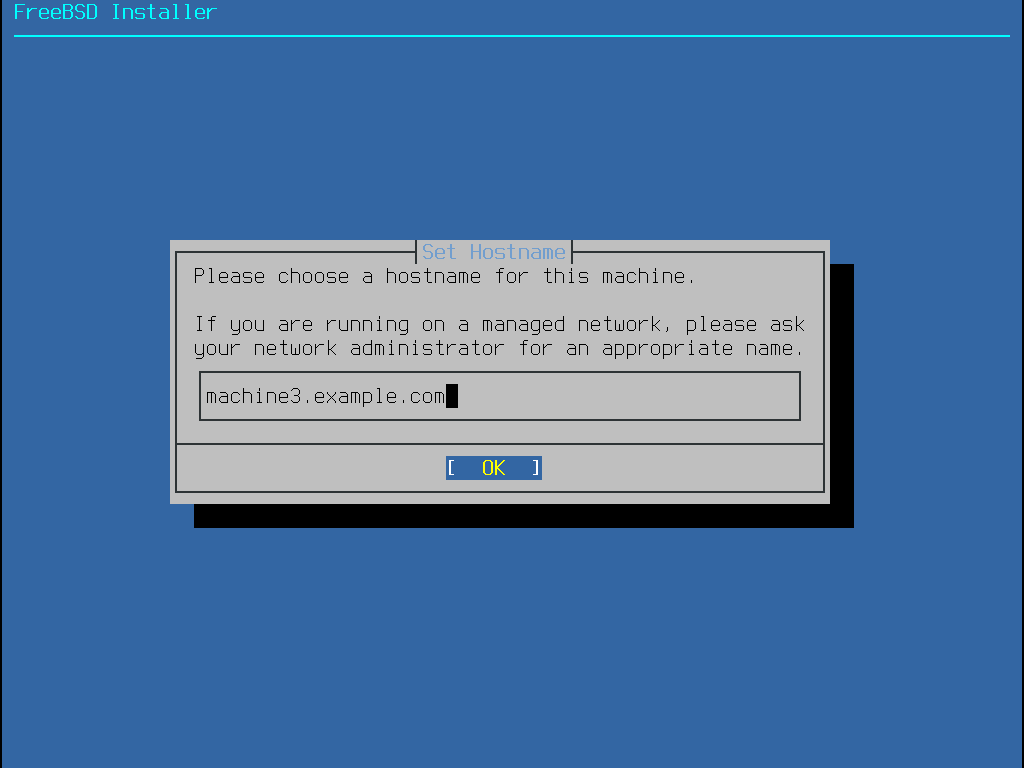
You will then be given the option to enter the machines hostname, enter in itlabcenter-freebsd and enter
Similar to Gentoo we can select individual packages or a distribution set of packages for our OS Kernel
Press the tab key to hover ver the Distribution Sets option and hit the enter key to continue with them
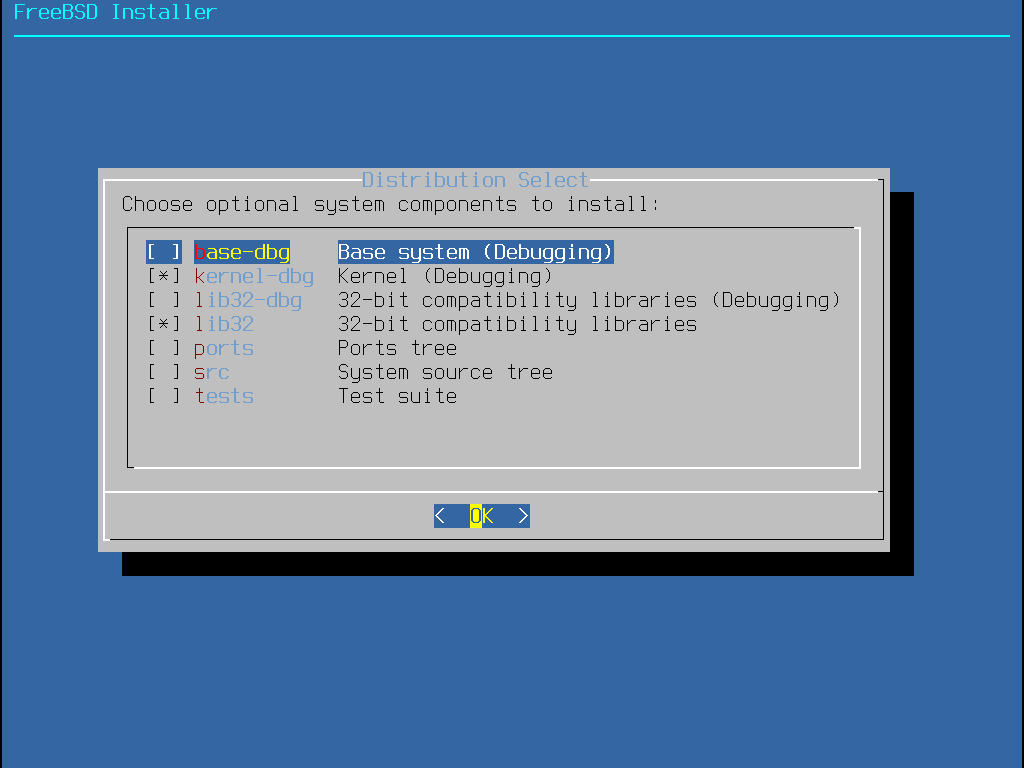
Use the space bar to select the following distribution packages and hit the Enter key to continue install
• base-dbg - Base tools like cat and ls, among many others
• kernel-dbg - Kernel Modules with debug symbols activated
• lib32 - Compatibility libraries for running 32-bit applications
• ports - automates the downloading, compiling and installation of packages
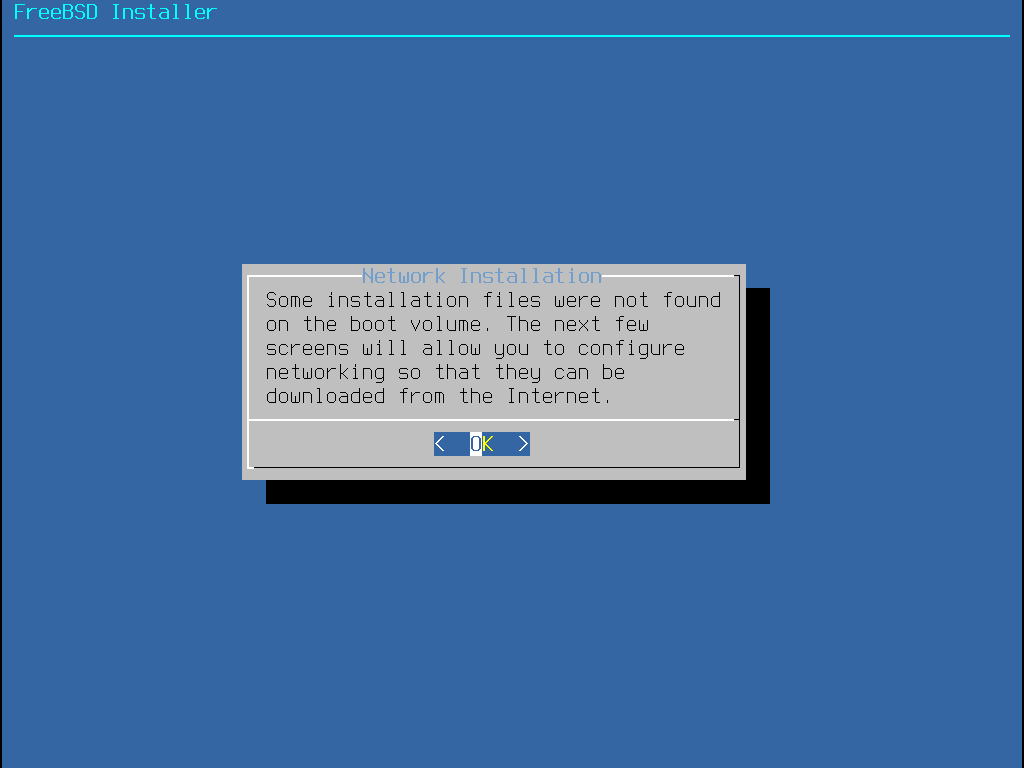
Next we will configure the network connection, select your interface and choose the auto configuration
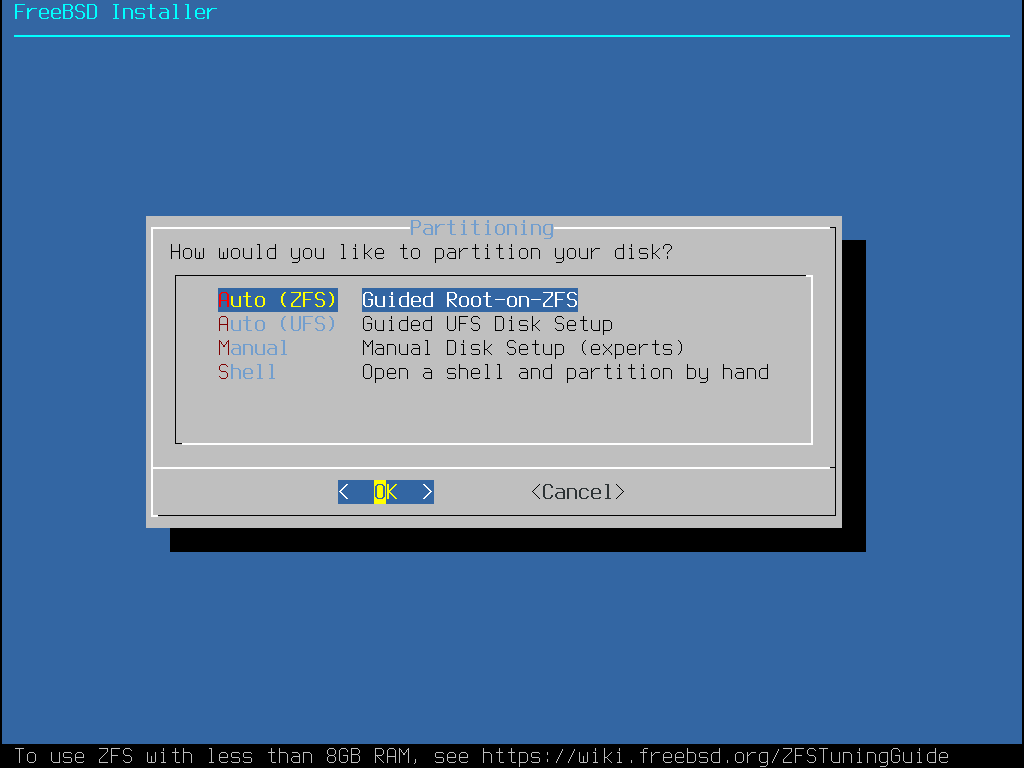
Following the network configuration we will partition our disks, select the option for Guided/Auto (UFS)
Select the disk you would like to install FreeBSD to, then press tab to hover over Entire Disk and Enter
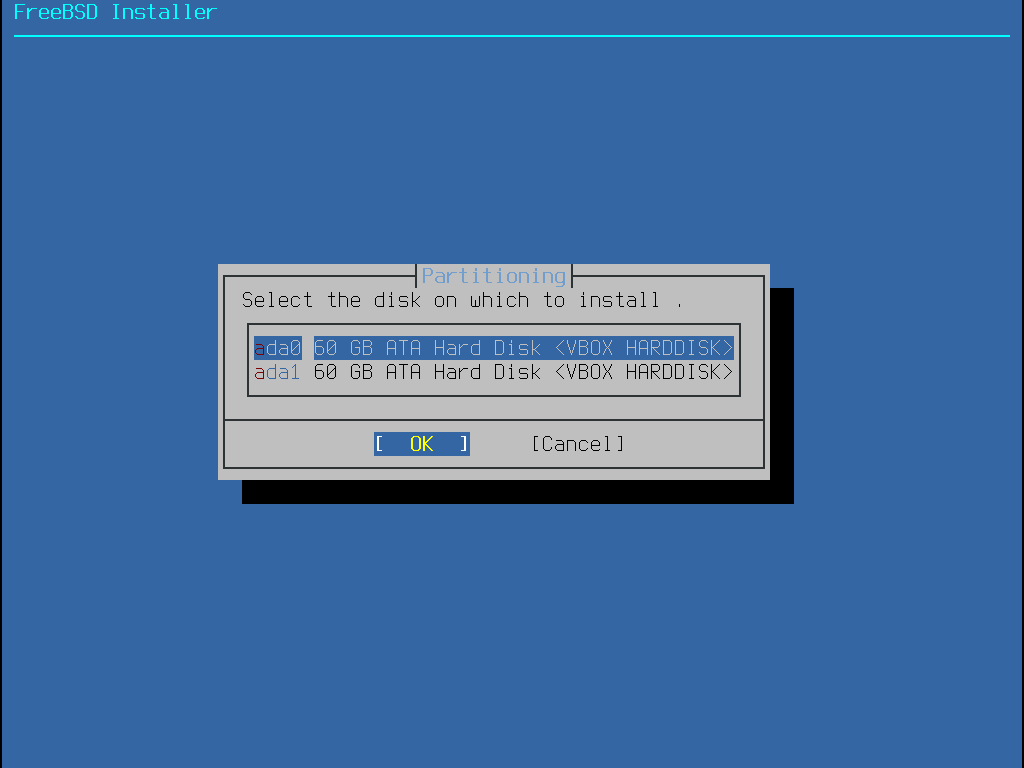
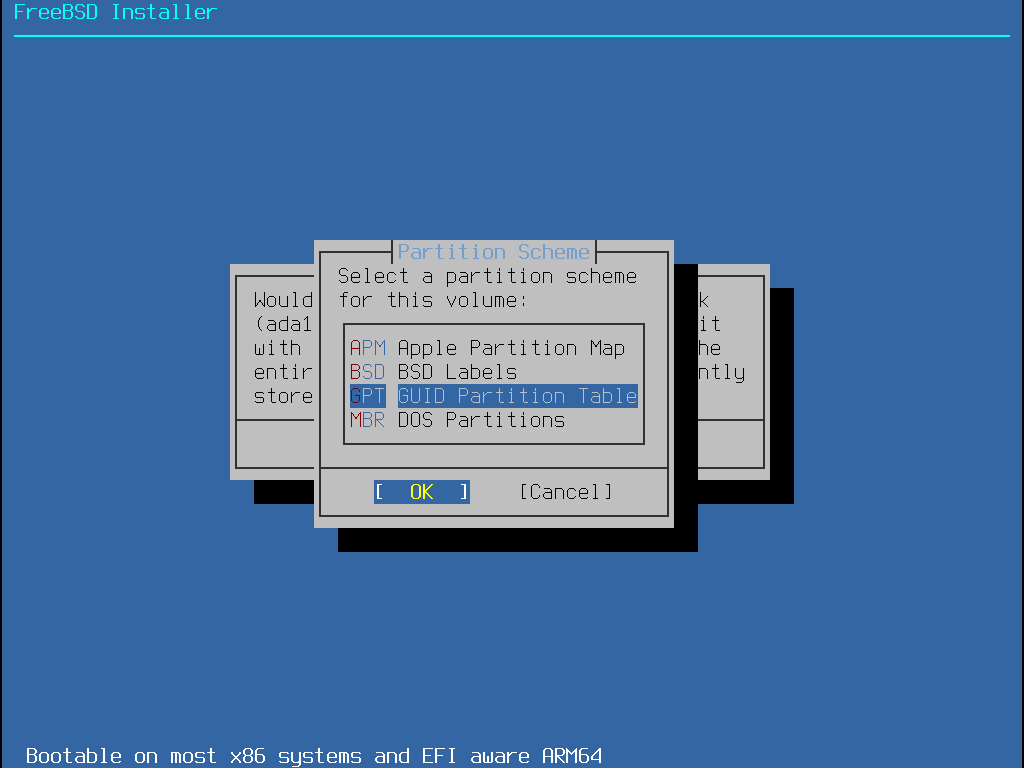
Press enter to confirm disk data erasure, then select the option for GPT GUID Partition Table and Enter
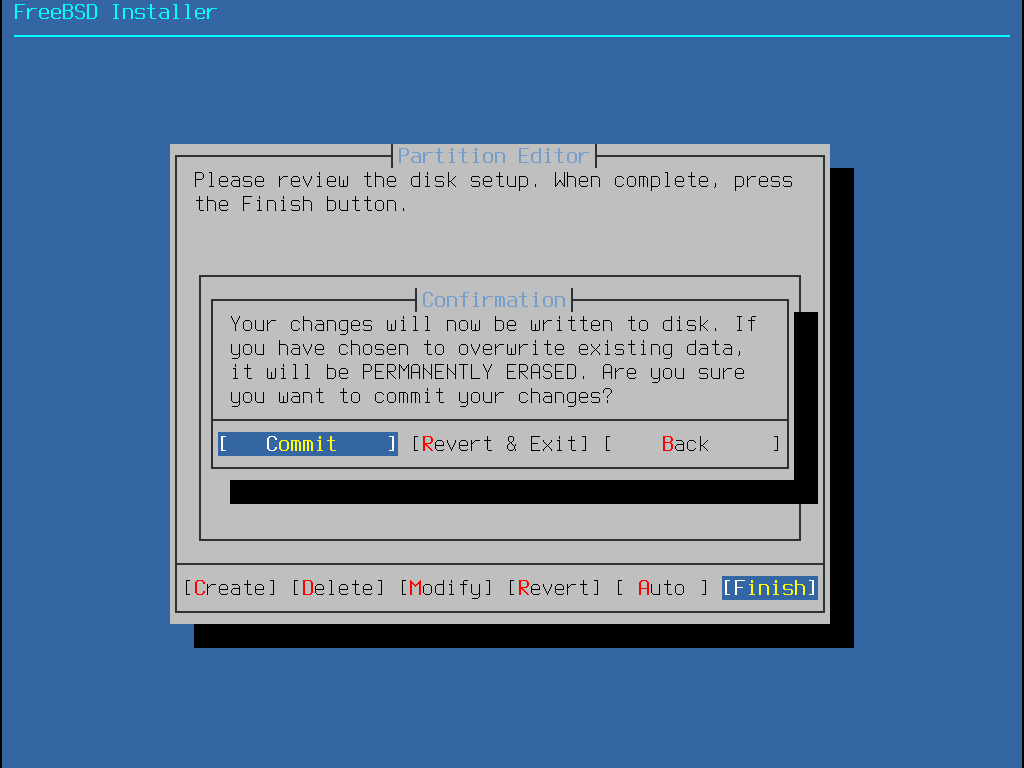
Hover over finish and press enter to confirm the default partitioning, then press enter to commit changes
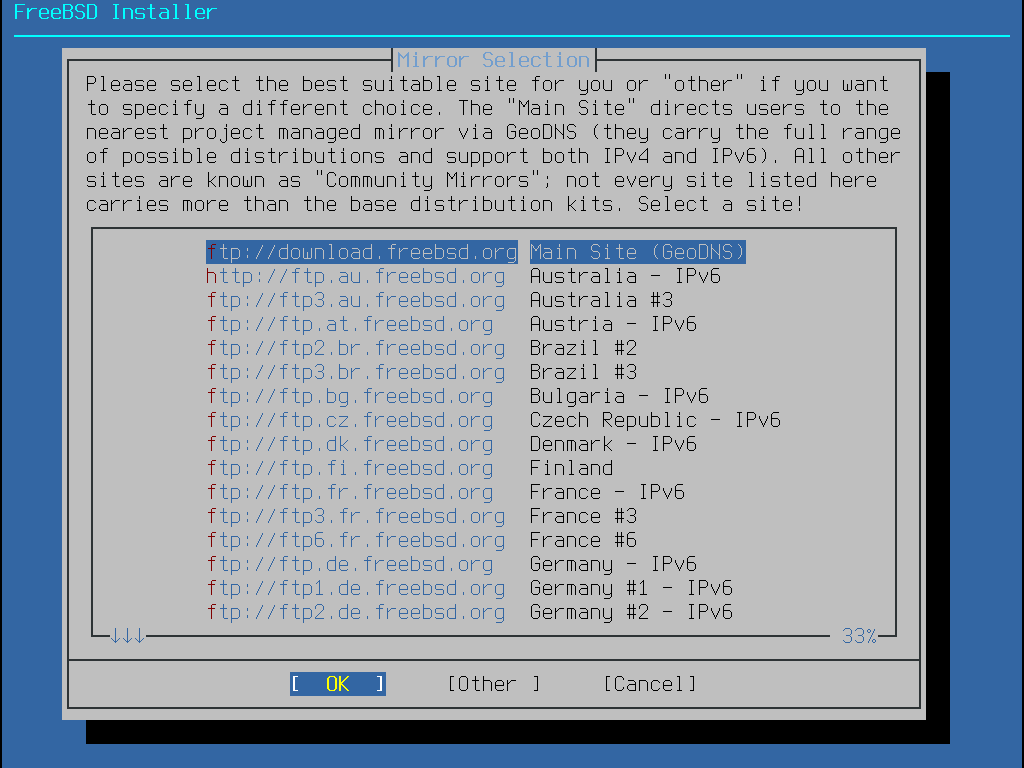
Next we can select the mirror we will use when downloading packages, for this lab press enter for default
Next we will set the root password, this should be a secure password but for this lab we use Password!23
Next we must set the time zone, press 2 and enter for North America then scroll to 49 and hit enter for US
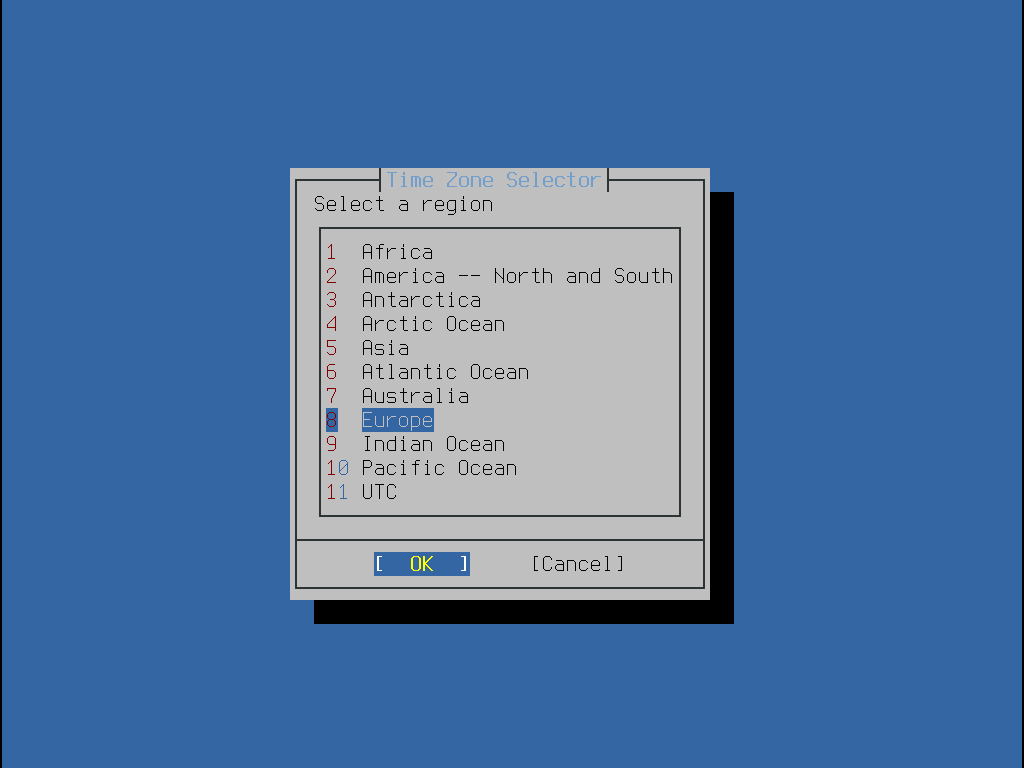
Press enter to select the default Eastern US region, then press enter to select the default Eastern Time
Press enter to skip setting the current date, then press enter to skip setting the current time for now
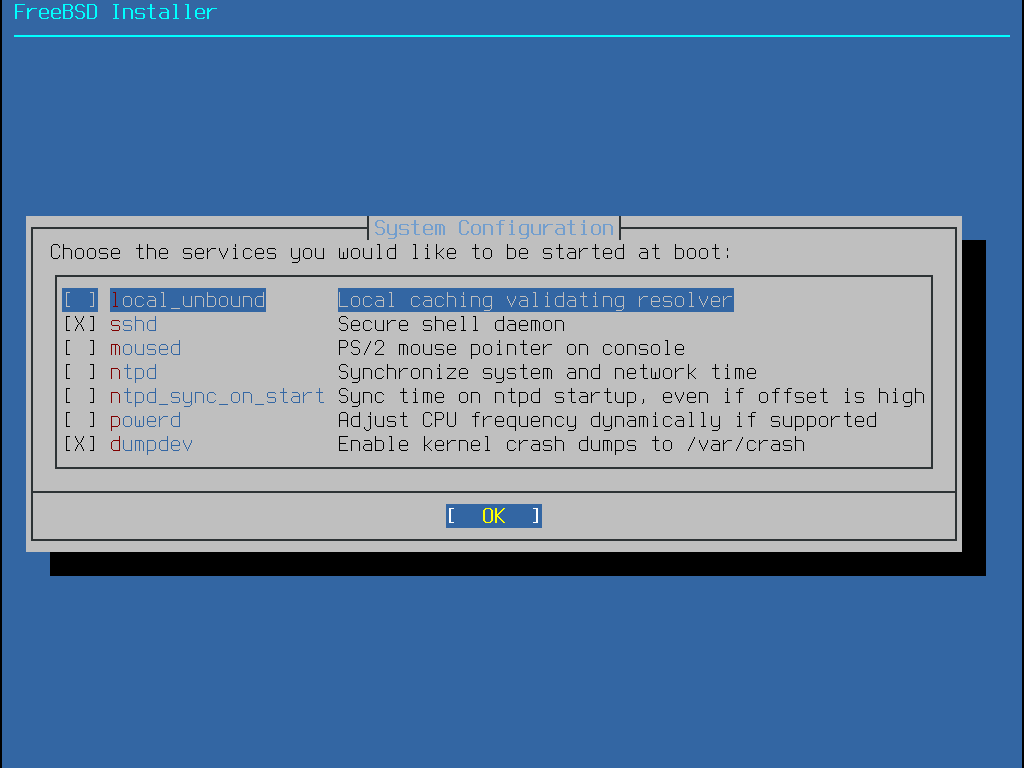
Next we select the system services, hover to ntpd and ntpd_sync_on_start and hit the space bar then enter
Next we have reached the system hardening options, this is where FreeBSD shines as a security appliance
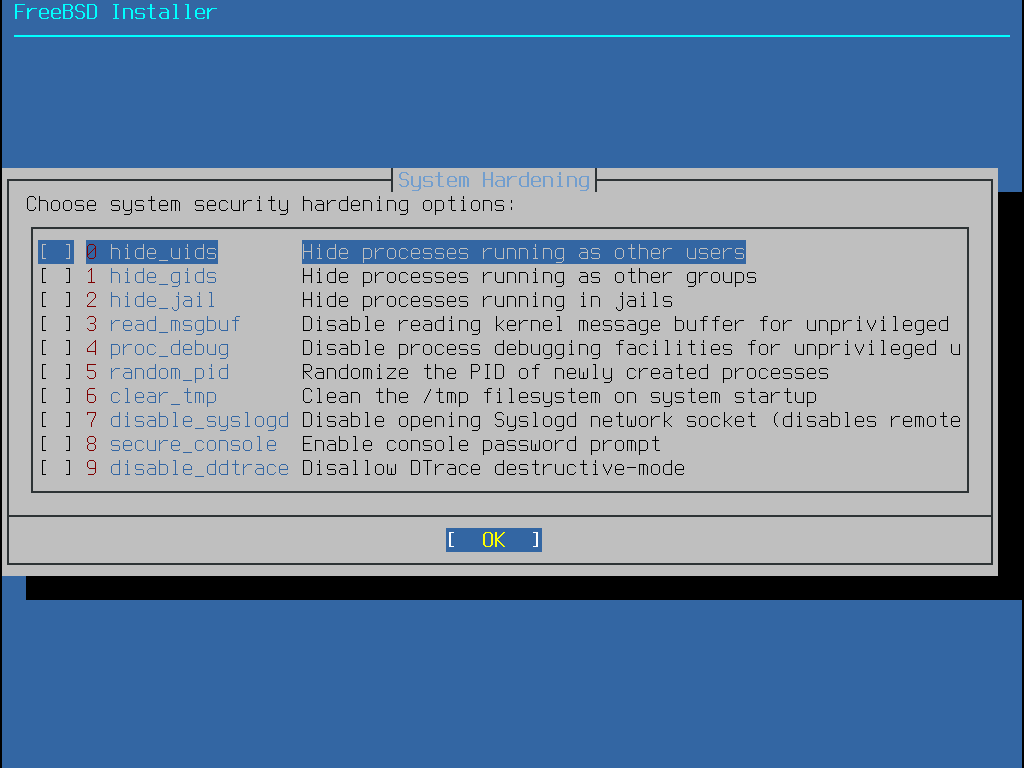
While each of these are optional and don't fully pertain to this lab, here is an overview of what we see
• hide_uids - This prevents unprivileged users from seeing running processes from other users
• hide_gids - This prevents unprivileged users from seeing running processes from other groups
• hide_jail - This prevents unprivileged users from seeing processes running inside jails
• read_msgbuf - This prevents unprivileged users from viewing messages from the kernel's log buffer
• proc_debug - This disables a variety of unprivileged inter-process debugging services
• random_pid - Randomizes the process ID of new processes, making them appear unidentifiable
• clear_tmp - Clean the /tmp directory when the system starts up
• disable_syslogd - Prevents syslog daemon from opening any tcp or udp ports for remote logging
• secure_consol - make the command prompt request the root password when entering single-user mode
• disable_ddtrace - DTrace cannot run with destructive actions which may affect the FreeBSD kernel
Any of these can be safely enabled, for the purposes of this lab however they are not strictly necessary
Press enter to continue. You may be prompted to install firmware, press enter to confirm and install them
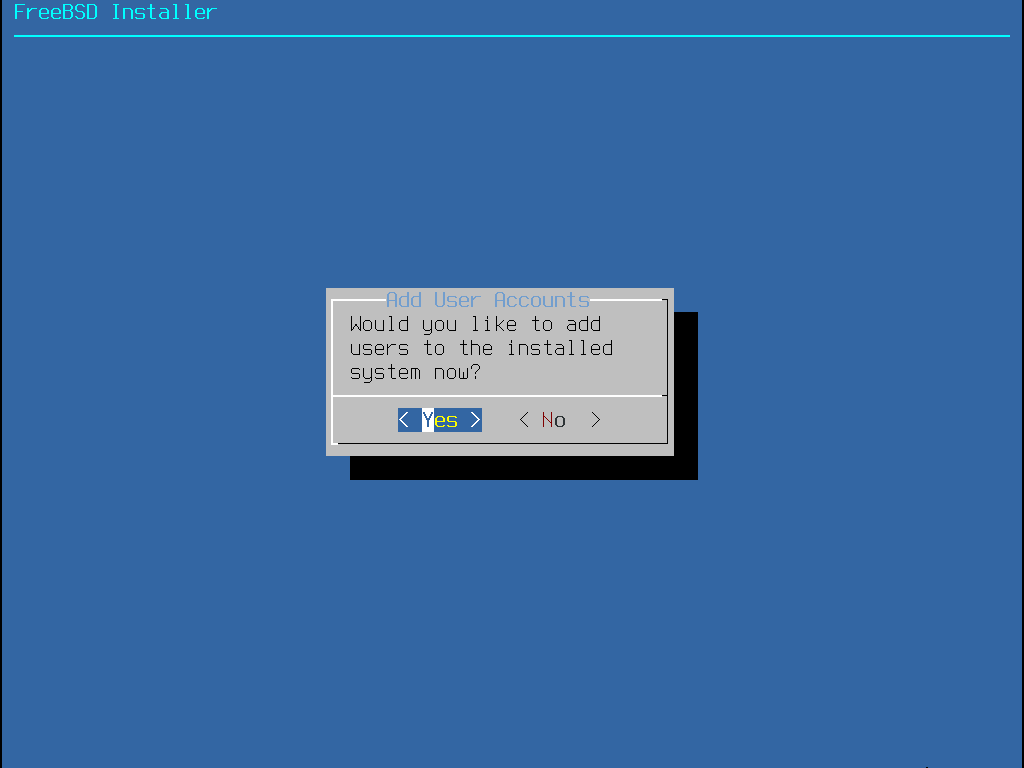
Now we will be provided the option to create our local user account, press the enter key to select yes:
Create the local user account using the following options, a blank area indicates no option and hit enter:
FreeBSD Installer
========================
Add Users
Username: itlab.center
Full name:
Uid (Leave empty for default):
Login group [itlab.center]:
Login group is itlab.center. Invite itlab.center into other groups? []: wheel video
Login class [default]:
Shell (sh csh tcsh nologin) [sh]:
Home directory [/home/itlab.center]:
Home directory permissions (Leave empty for default):
Use password-based authentication? [yes]:
Use an empty password? (yes/no) [no]:
Use a random password? (yes/no) [no]:
Enter password: Password!23
Enter password again: Password!23
Lock out the account after creation? [no]:
Username : itlab.center
Password : *****
Full Name :
Uid : 1001
Class :
Groups : itlab.center wheel
Home : /home/itlab.center
Home Mode :
Shell : /bin/sh
Locked : no
OK? (yes/no) [yes]:
adduser: INFO: Successfully added (itlab.center) to the user database.
Add another user? (yes/no) [no]: no
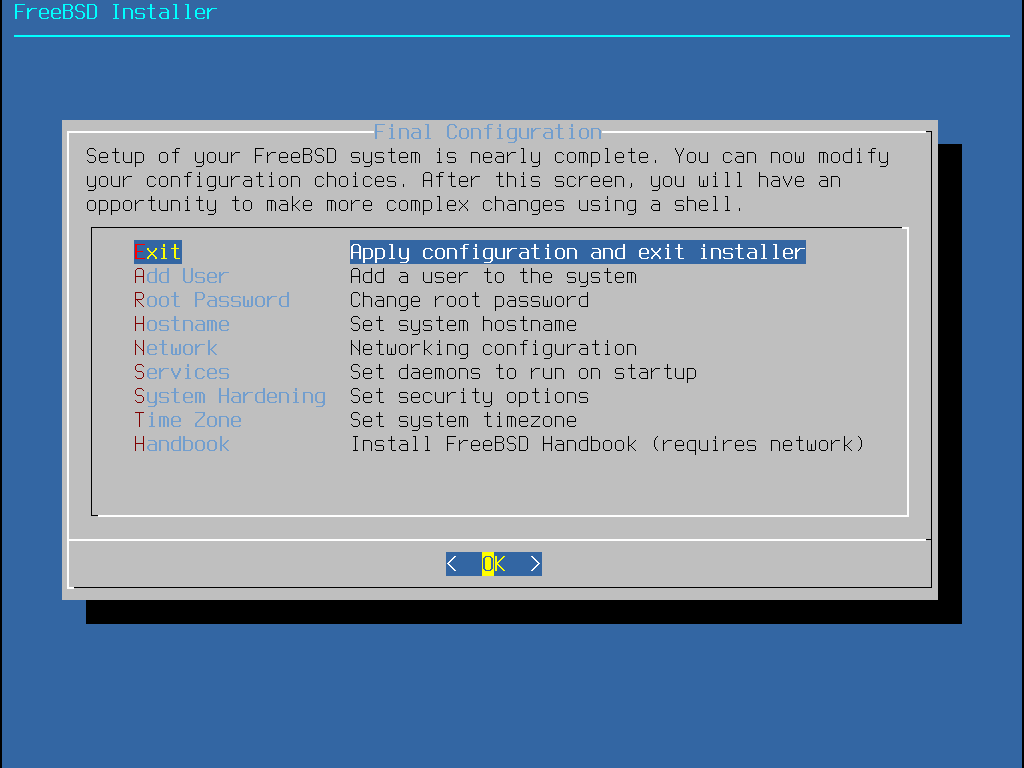
Lastly we have an overview of the installation areas, press enter to finish the installation and reboot
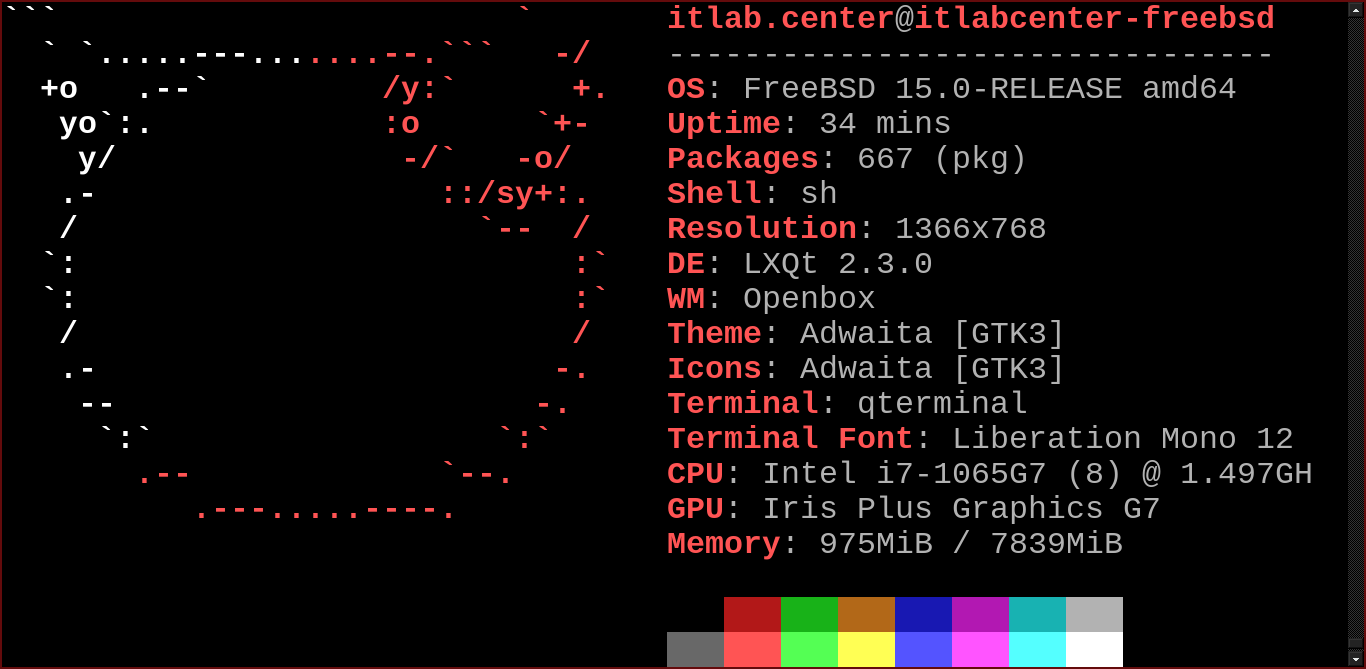
After a reboot we will be taken to the command line and prompted to log in. The installation is complete
3. Install Lab Tools
Now that our base system is installed, there are some additional tools for us to install on our FreeBSD
While not strictly necessary and usually excluded from security appliances, desktops are easy to showcase
When the FreeBSD boots up for the first time select the Multi-User boot option, you will be taken to login
FreeBSD/amd64 (itlabcenter-freebsd) (ttyv0)
login:
Enter root in the login field and login to the root account with the password we created during install
Run the following commands from the FreeBSD Root Terminal to install the display manager and LXQT desktop
root@itlabcenter-freebsd:~ # pkg install xorg lxqt sddm drm-kmod nano git
root@itlabcenter-freebsd:~ # sysrc dbus_enable="YES"
root@itlabcenter-freebsd:~ # sysrc sddm_enable="YES"
root@itlabcenter-freebsd:~ # sysrc kld_list="i915kms"
root@itlabcenter-freebsd:~ # echo 'proc /proc procfs rw 0 0' >> /etc/fstab
root@itlabcenter-freebsd:~ # sddm --example-config > /usr/local/etc/sddm.conf
root@itlabcenter-freebsd:~ # rm /usr/local/etc/sddm.conf.default
Run the following command from the FreeBSD Root Terminal to edit the sudoers privilege configuration file
root@itlabcenter-freebsd:~ # nano /usr/local/etc/sudoers
Now find the line below and remove the hashtag and space to allow members of the wheel group to use sudo:
# %wheel ALL=(ALL:ALL) ALL
Run the following command from the FreeBSD Root Terminal to install the FreeBSD SDDM login manager theme
root@itlabcenter-freebsd:~ # git clone https://github.com/tuaris/sddm-theme-freebsd
root@itlabcenter-freebsd:~ # cp -R sddm-theme-freebsd/src /usr/local/share/sddm/themes/sddm-freebsd-black-theme
root@itlabcenter-freebsd:~ # ln -s /usr/local/bin/sddm-greeter-qt6 /usr/local/bin/sddm-greeter
Run the following command from the FreeBSD Root Terminal to edit the configuration file for this theme:
root@itlabcenter-freebsd:~ # nano /usr/local/share/sddm/themes/sddm-freebsd-black-theme/theme.conf
Adjust the themes configuration file to declare the absolute path for the background image as shown below
[General]
background=/usr/local/share/sddm/themes/sddm-freebsd-black-theme/background.png
displayFont="Montserrat"
Run the following command from the FreeBSD Root Terminal to edit the SDDM login manager configuration file
root@itlabcenter-freebsd:~ # nano /usr/local/etc/sddm.conf
Now find the line below and change it as follows to enable the FreeBSD black login screen theme for SDDM
[Theme]
Current=sddm-freebsd-black-theme
Run the following command from the FreeBSD Root Terminal to reboot the system and launch our LXQT desktop
root@itlabcenter-freebsd:~ # reboot
Once our system performs a reboot we will be taken to our custom login screen with minimal session options
It is important to select the LXQT Desktop session here when logging in for our desktop to load properly
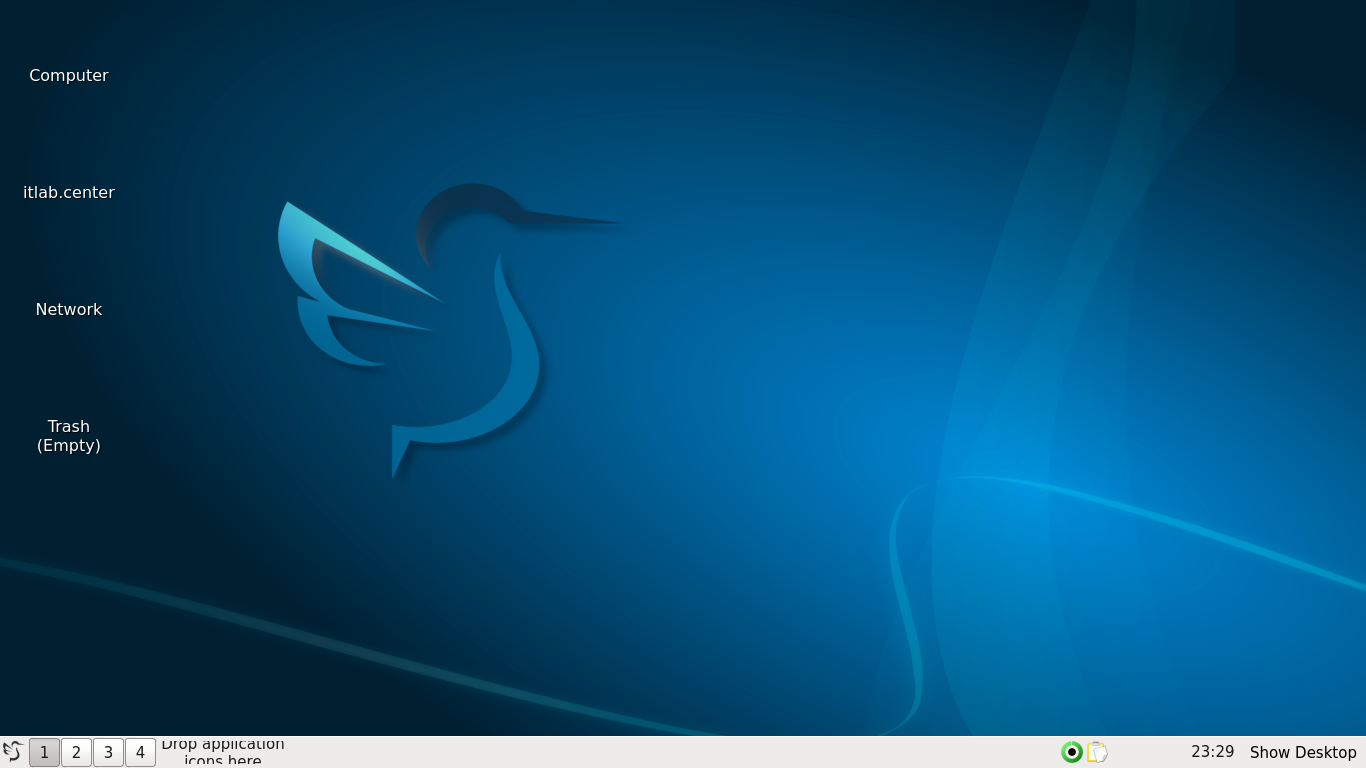
As you can see our desktop icons did not load, that is because they are not installed by default in LXQT
Click the bird icon in the lower-left hand corner, then head to System tools and open the Qterminal App
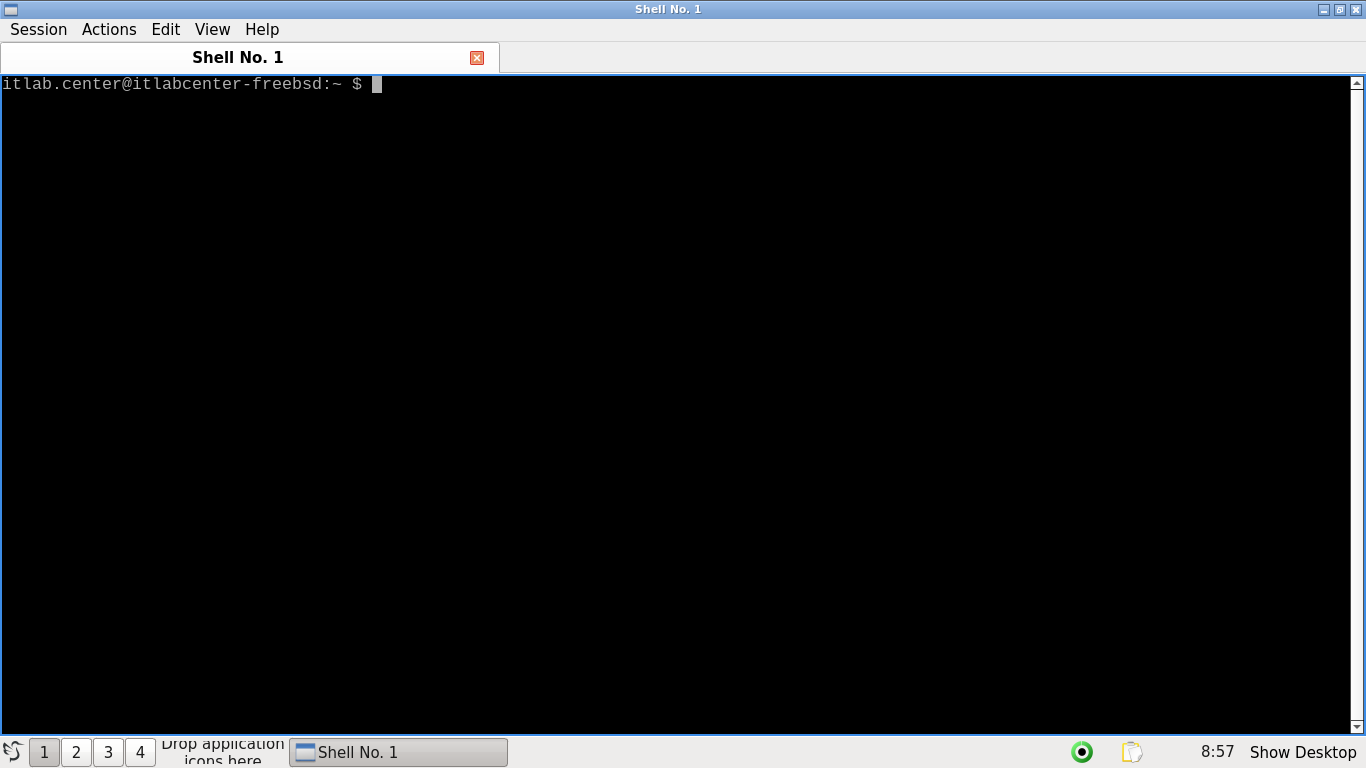
We will work primarily from this terminal for the remainder of this lab on intrusion detection systems
Run the following command from the FreeBSD QTerminal to install a package of icons for our LXQT desktop
itlab.center@itlabcenter-freebsd:~ $ sudo pkg install papirus-icon-theme
Now click the bird icon in the lower-left hand corner and then click the LXQt Configuration Center option
Double click Appearance, then head to Icons Theme and select the Papirus-Dark option, then click Apply
You can also use this configuration menu to set custom themes for windows, the toolbar and the desktop:
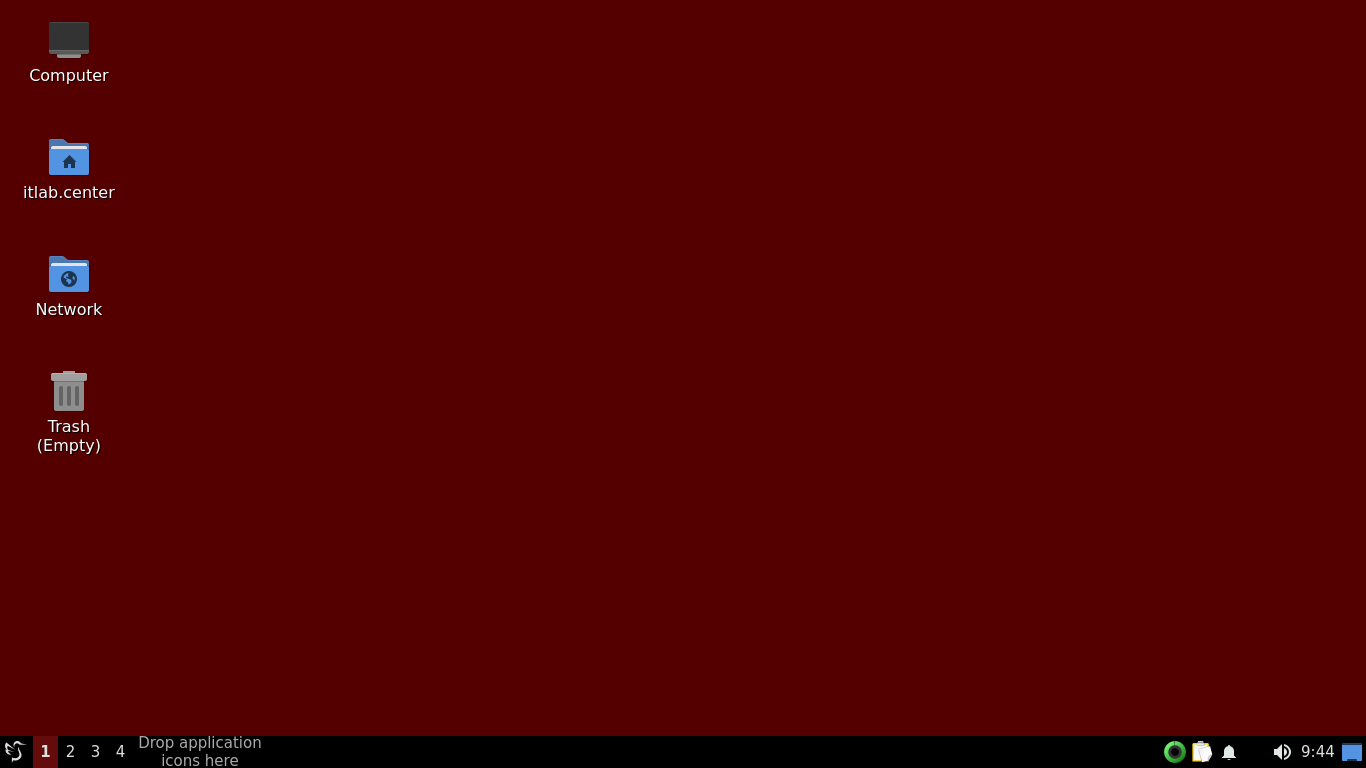
Now that we have finished ricing our desktop environment, let's install the tools we will use for the lab
Run the following command from the FreeBSD Qterminal to install snort, nmap, u2spewfoo and a MySQL client
itlab.center@itlabcenter-freebsd:~ $ sudo pkg install snort wget mysql80-client curl nmap
Now that we have our desktop and our tools installed we can move on to the lab exercise on IDS systems
4. Snort Syntax & Modes
In this part of the lab, you will start snort from the command line and get acquainted with its interface
Run the following command from the FreeBSD Qterminal to start snort from the linux command line interface
itlab.center@itlabcenter-freebsd:~ $ sudo snort
You will see live packet captures in progress, the various ports displayed are based on your router probes
By default, Snort will start in sniffer mode, where it will behave much like the tcpdump packet captures
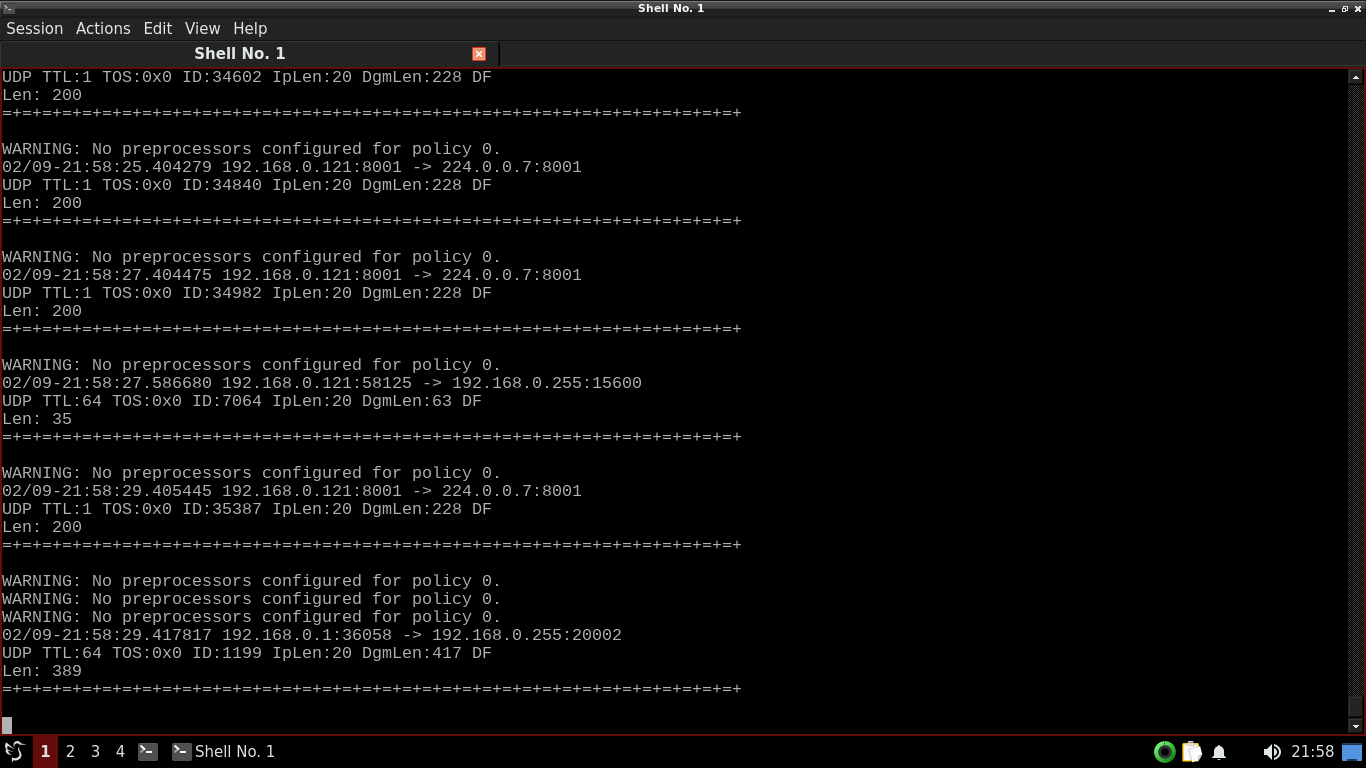
In the screenshot above, we see that 192.168.0.1 is accessing 192.168.0.255 over TCP ports 36058 and 20002
Your output may differ but should be just as readable. The warnings means that Snort wasn't given configs
Hit CTRL+C to shut down Snort, then take note of all the network capture information that Snort provides:
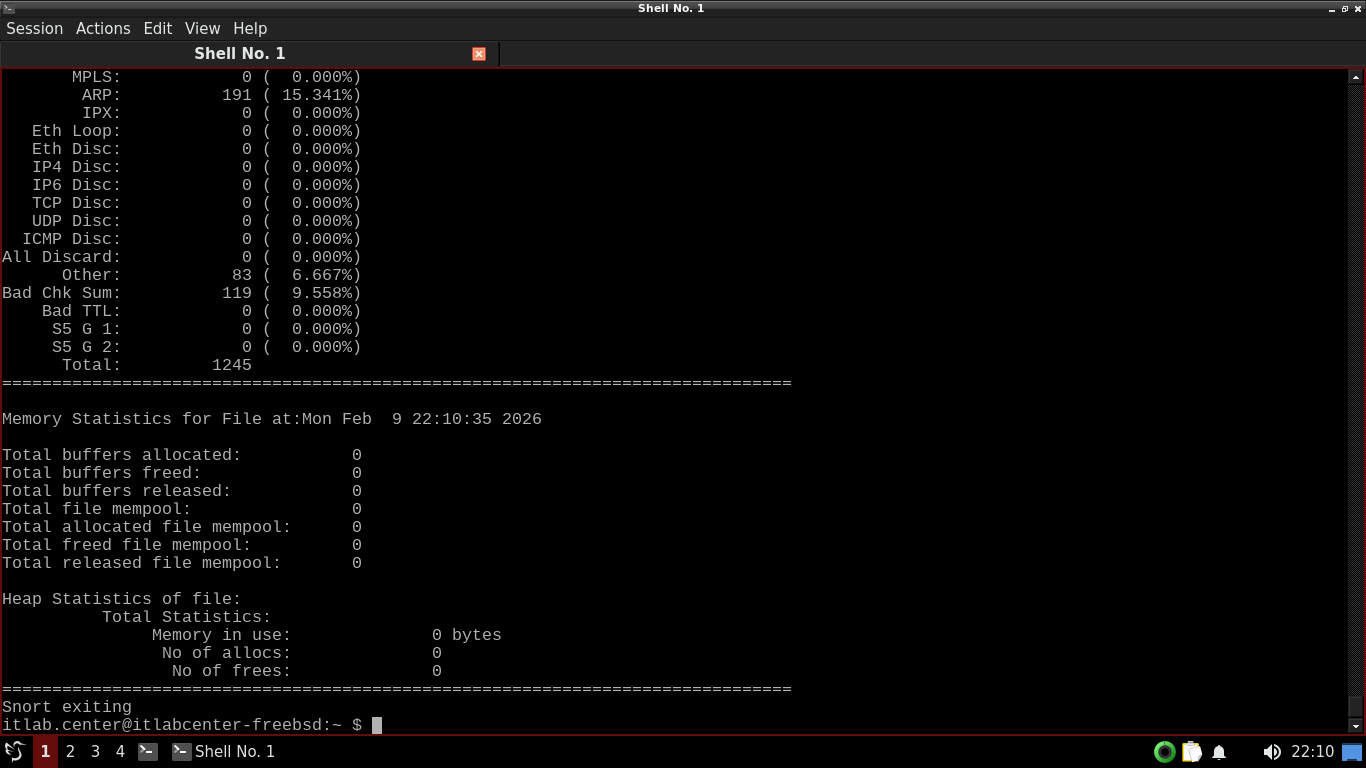
We can see the packets captures, packets analyzed vs packets dropped, and a full protocol breakdown above
Run the following commands from the FreeBSD Qterminal to clear the console and validate snorts config file
itlab.center@itlabcenter-freebsd:~ $ clear
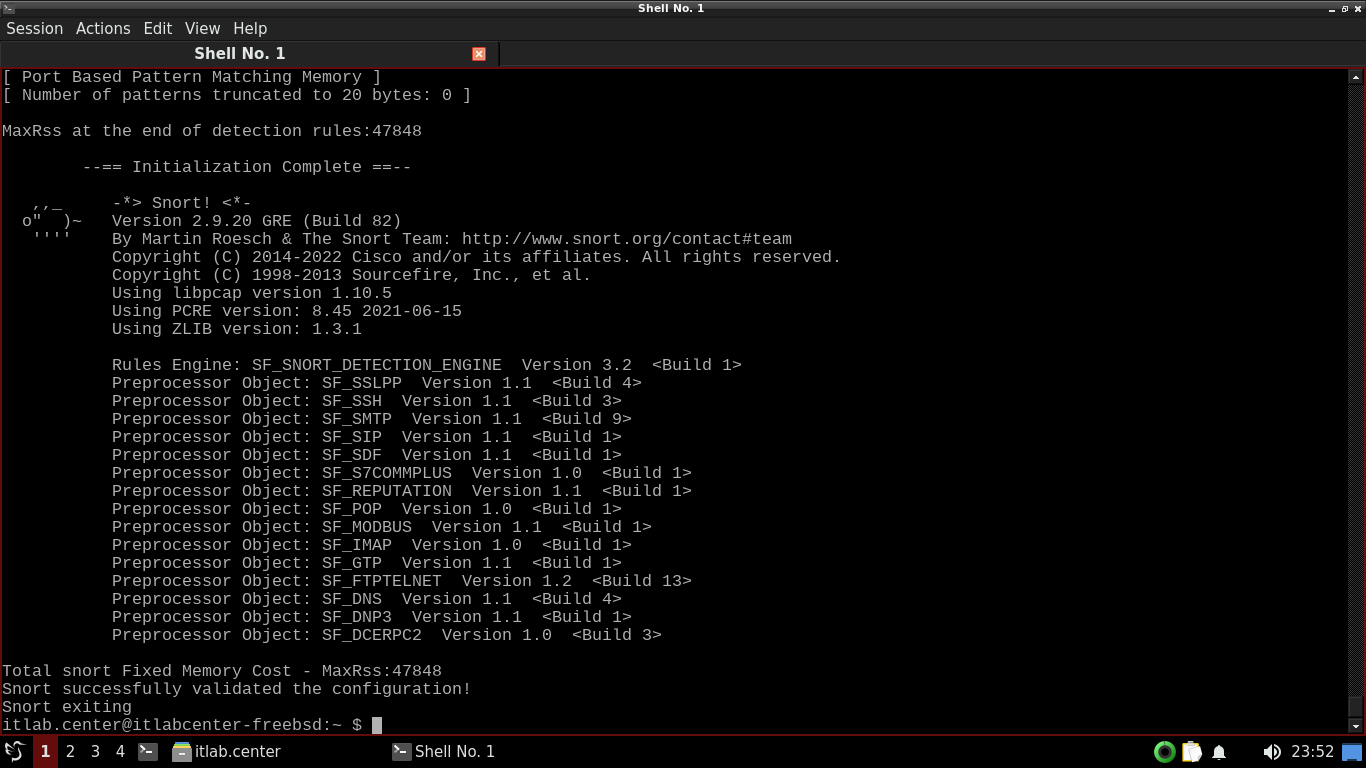
itlab.center@itlabcenter-freebsd:~ $ sudo snort -T -c /usr/local/etc/snort/snort.conf
Resulting Output:
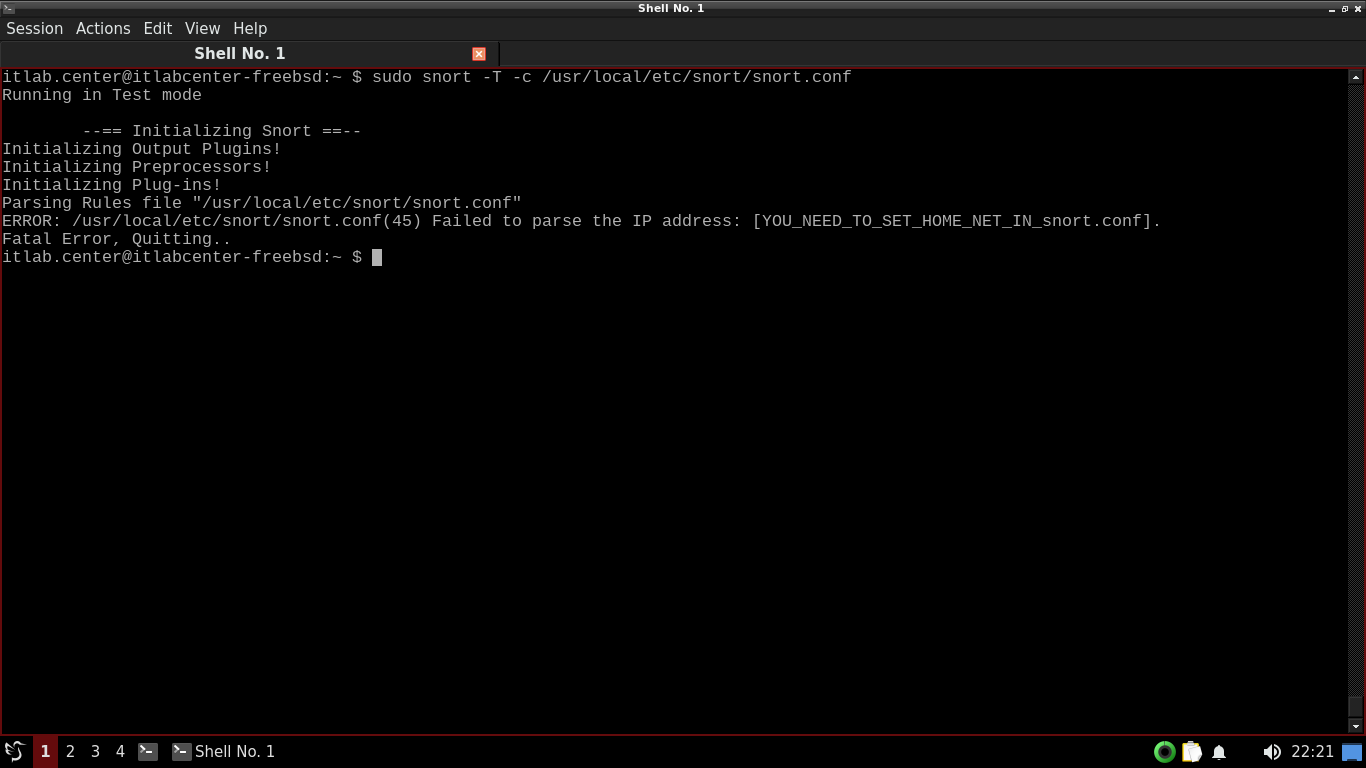
By default, Snort keeps a default configuration file (snort.conf) inside /usr/local/etc/snort on FreeBSD
The -T option means test and the -c option tells snort where to find its default configuration file at
We can see that the test on our configuration file has failed, and that is because we have not configured
Run the following command from the FreeBSD Qterminal to open and edit the snort config file with nano:
itlab.center@itlabcenter-freebsd:~ $ sudo nano /usr/local/etc/snort/snort.conf
Resulting Output:
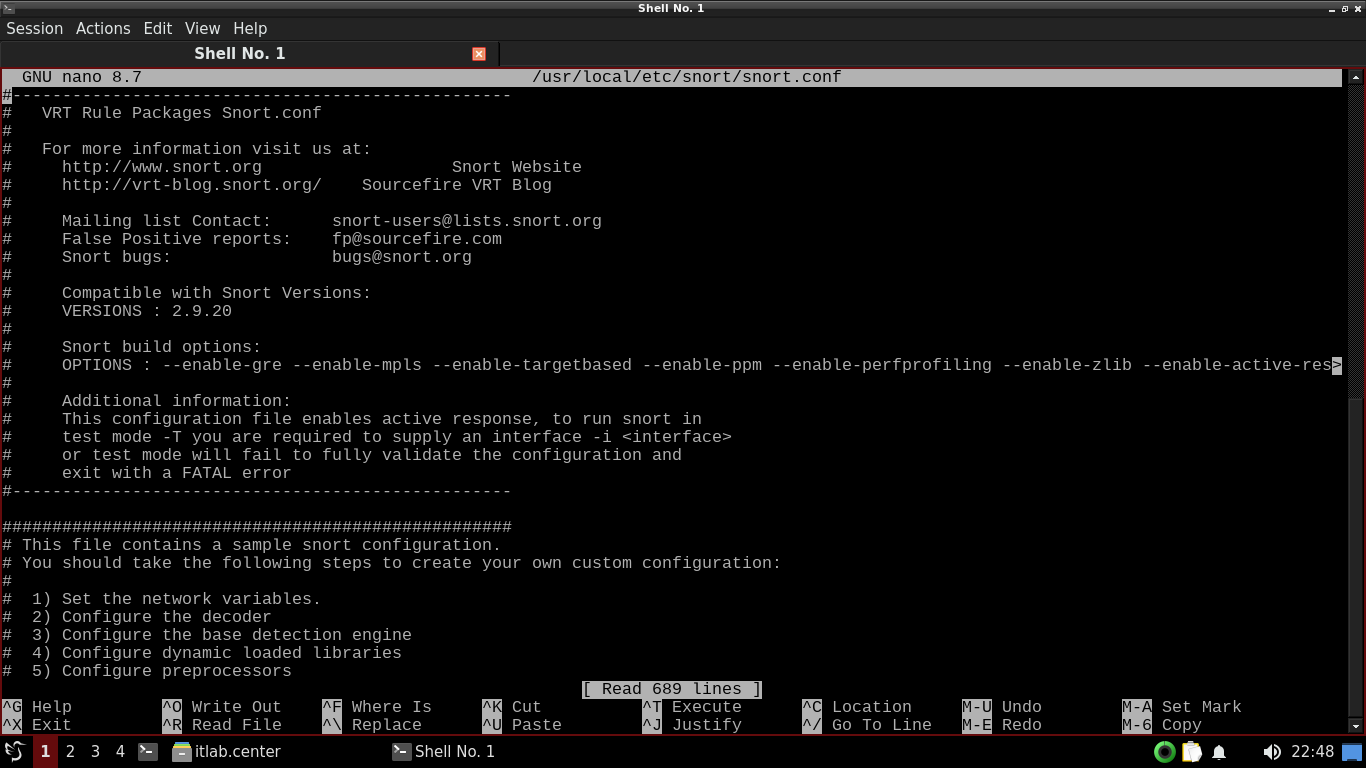
A few changes will need to be made here, find the following line and add our local network to guard below
ipvar HOME_NET 192.168.0.0/24
Hit CTRL+O to write the change to our snort configuration file and then hit CTRL+X to exit the nano editor
Run the following commands from the FreeBSD Qterminal to create a rules directory and empty rules files:
itlab.center@itlabcenter-freebsd:~ $ mkdir -p ./rules
itlab.center@itlabcenter-freebsd:~ $ touch ./rules/local.rules ./rules/app-detect.rules ./rules/attack-responses.rules ./rules/backdoor.rules
itlab.center@itlabcenter-freebsd:~ $ touch ./rules/bad-traffic.rules ./rules/blacklist.rules ./rules/botnet-cnc.rules ./rules/browser-chrome.rules
itlab.center@itlabcenter-freebsd:~ $ touch ./rules/browser-firefox.rules ./rules/browser-ie.rules ./rules/browser-other.rules ./rules/browser-plugins.rules
itlab.center@itlabcenter-freebsd:~ $ touch ./rules/browser-webkit.rules ./rules/chat.rules ./rules/content-replace.rules ./rules/ddos-rules ./rules/dns-rules
itlab.center@itlabcenter-freebsd:~ $ touch ./rules/dos.rules ./rules/experimental.rules ./rules/exploit-kit.rules ./rules/exploit.rules ./rules/file-executable.rules
itlab.center@itlabcenter-freebsd:~ $ touch ./rules/file-flash.rules ./rules/file-identify.rules ./rules/file-image.rules ./rules/file-multimedia.rules
itlab.center@itlabcenter-freebsd:~ $ touch ./rules/file-office.rules ./rules/file-other.rules ./rules/file-pdf.rules ./rules/finger.rules ./rules/ftp.rules
itlab.center@itlabcenter-freebsd:~ $ touch ./rules/icmp-info.rules ./rules/icmp.rules ./rules/imap.rules ./rules/indicator-compromise.rules ./rules/x11.rules
itlab.center@itlabcenter-freebsd:~ $ touch ./rules/indicator-obfuscation.rules ./rules/indicator-shellcode.rules ./rules/info.rules ./rules/malware-backdoor.rules
itlab.center@itlabcenter-freebsd:~ $ touch ./rules/malware-cnc.rules ./rules/malware-other.rules ./rules/malware-tools.rules ./rules/misc.rules
itlab.center@itlabcenter-freebsd:~ $ touch ./rules/multimedia.rules ./rules/mysql.rules ./rules/netbios.rules ./rules/nntp.rules ./rules/oracle.rules
itlab.center@itlabcenter-freebsd:~ $ touch ./rules/os-linux.rules ./rules/os-other.rules ./rules/os-solaris.rules ./rules/os-windows.rules ./rules/other-ids.rules
itlab.center@itlabcenter-freebsd:~ $ touch ./rules/p2p.rules ./rules/phishing-spam.rules ./rules/policy-multimedia.rules ./rules/policy-other.rules
itlab.center@itlabcenter-freebsd:~ $ touch ./rules/policy.rules ./rules/policy-social.rules ./rules/policy-spam.rules ./rules/pop2.rules ./rules/pop3.rules
itlab.center@itlabcenter-freebsd:~ $ touch ./rules/protocol-finger.rules ./rules/protocol-ftp.rules ./rules/protocol-icmp.rules ./rules/protocol-imap.rules
itlab.center@itlabcenter-freebsd:~ $ touch ./rules/protocol-pop.rules ./rules/protocol-services.rules ./rules/protocol-voip.rules ./rules/pua-adware.rules
itlab.center@itlabcenter-freebsd:~ $ touch ./rules/pua-other.rules ./rules/pua-p2p.rules ./rules/pua-toolbars.rules ./rules/rpc.rules ./rules/rservices.rules
itlab.center@itlabcenter-freebsd:~ $ touch ./rules/scada.rules ./rules/scan.rules ./rules/server-apache.rules ./rules/server-iis.rules ./rules/server-mail.rules
itlab.center@itlabcenter-freebsd:~ $ touch ./rules/server-mssql.rules ./rules/server-mysql.rules ./rules/server-oracle.rules ./rules/server-other.rules
itlab.center@itlabcenter-freebsd:~ $ touch ./rules/server-webapp.rules ./rules/shellcode.rules ./rules/smtp.rules ./rules/snmp.rules ./rules/specific-threats.rules
itlab.center@itlabcenter-freebsd:~ $ touch ./rules/spyware-put.rules ./rules/sql.rules ./rules/telnet.rules ./rules/tftp.rules ./rules/virus.rules ./rules/voip.rules
itlab.center@itlabcenter-freebsd:~ $ touch ./rules/web-activex.rules ./rules/web-attacks.rules ./rules/web-cgi.rules ./rules/web-client.rules
itlab.center@itlabcenter-freebsd:~ $ touch ./rules/web-coldfusion.rules ./rules/web-frontpage.rules ./rules/web-iis.rules ./rules/web-misc.rules ./rules/web-php.rules
itlab.center@itlabcenter-freebsd:~ $ sudo mkdir -p /usr/local/etc/rules
itlab.center@itlabcenter-freebsd:~ $ sudo touch /usr/local/etc/rules/white_list.rules /usr/local/etc/rules/black_list.rules
As you can see, there are a massive amount of configuration options available when using the snort tool
This is far beyond the scope of this lab, but it is good for you to get exposure to the tools sheer scale
Run the following command from the FreeBSD Qterminal to re-initiate a test of Snorts configuration file:
itlab.center@itlabcenter-freebsd:~ $ sudo snort -T -c /usr/local/etc/snort/snort.conf
Resulting Output:
Our Snort Intrusion Detection System is now displaying that it has a proper configuration of its ruleset
Run the following command from the FreeBSD Qterminal to start the Snort tool in intrusion detection mode
itlab.center@itlabcenter-freebsd:~ $ sudo snort -c /usr/local/etc/snort/snort.conf
Resulting Output:
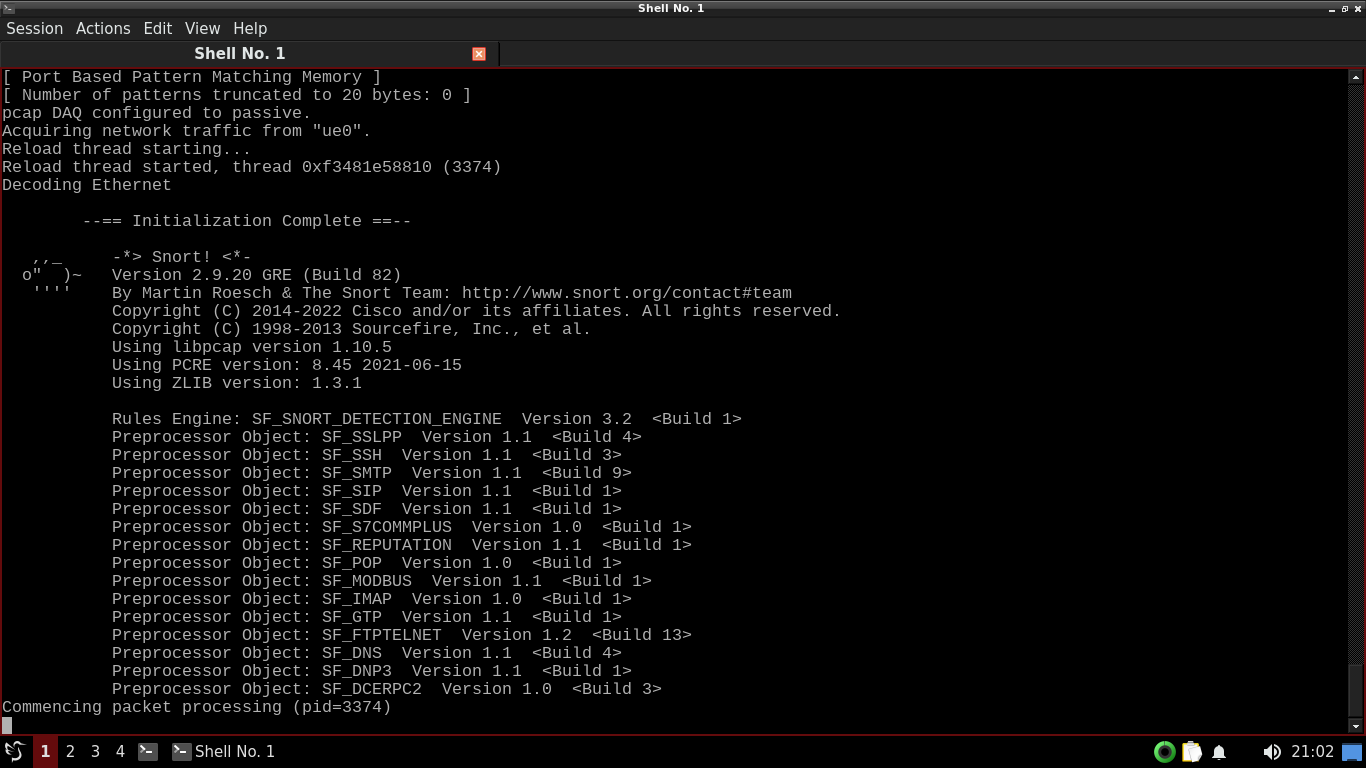
In Intrusion Detection Mode, Snort compares all traffic captured against a large base of rules we created
Because this is an isolated lab environment, we don't expect there to be a large volume of network traffic
When running Snort in intrusion detection mode on your home network, you may find a large number of alerts
These are most likely not real attacks, like any IDS, Snort needs to be tuned to reduce false positives
Press CTRL+C tp stop Snort. You will notice again that Snort prints out a lot of network packet information
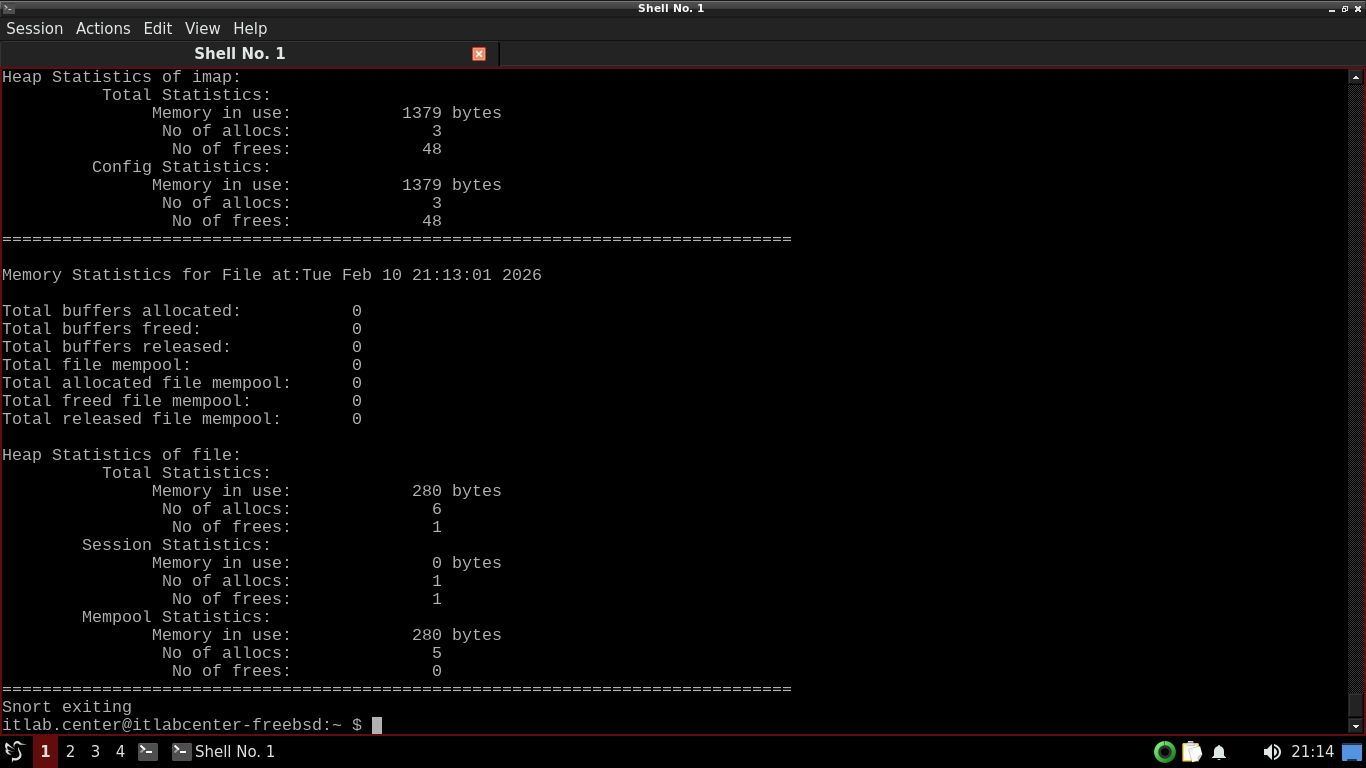
When Snort runs in Intrusion Detection mode, you will see additional statistics on actions such as alerts
Snort is capable of reading packet capture files, just like tcpdump and Wireshark, let's try to read some
TCPDump is a packet capture tool similar to wireshark but operates and is invoked entirely from the CLI
Run the following command from the FreeBSD Qterminal to start a capture and save results to a .pcap file
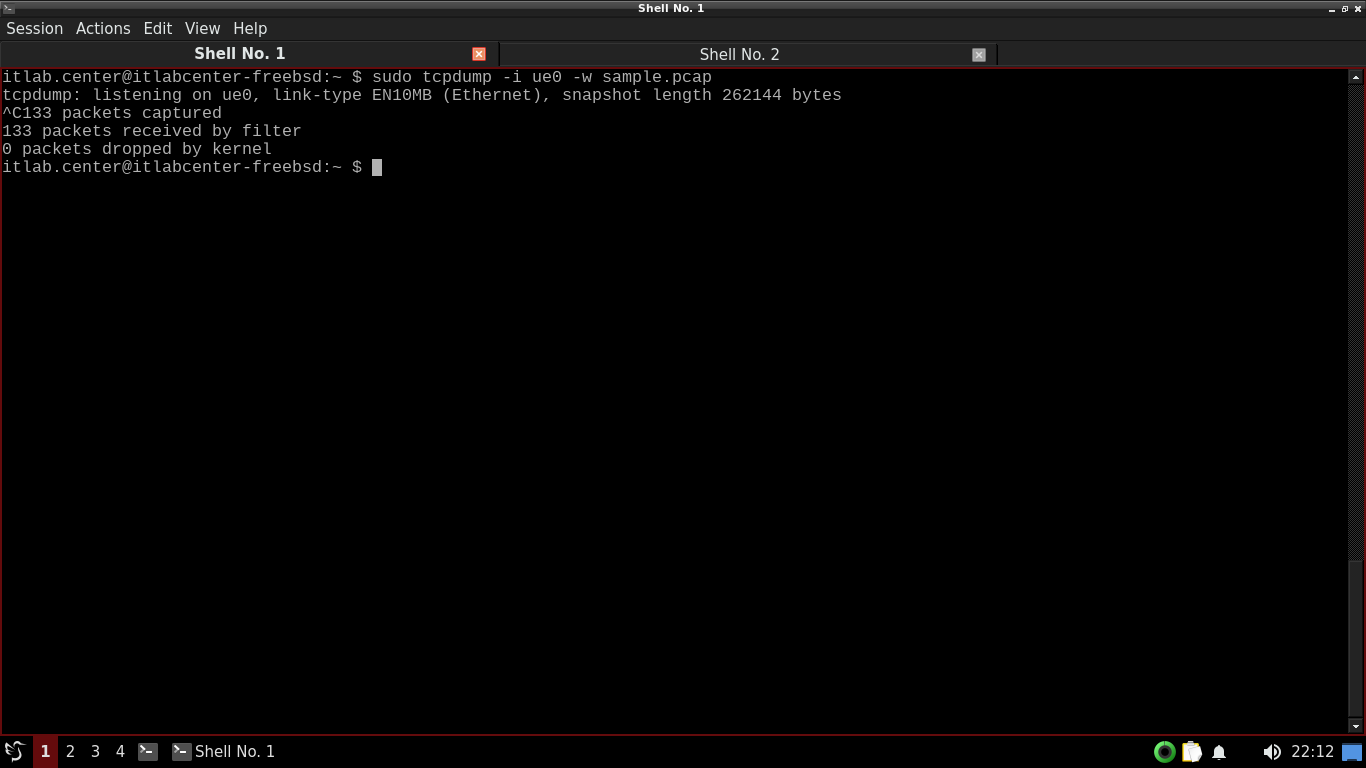
itlab.center@itlabcenter-freebsd:~ $ sudo tcpdump -i ue0 -w sample.pcap
Resulting Output:
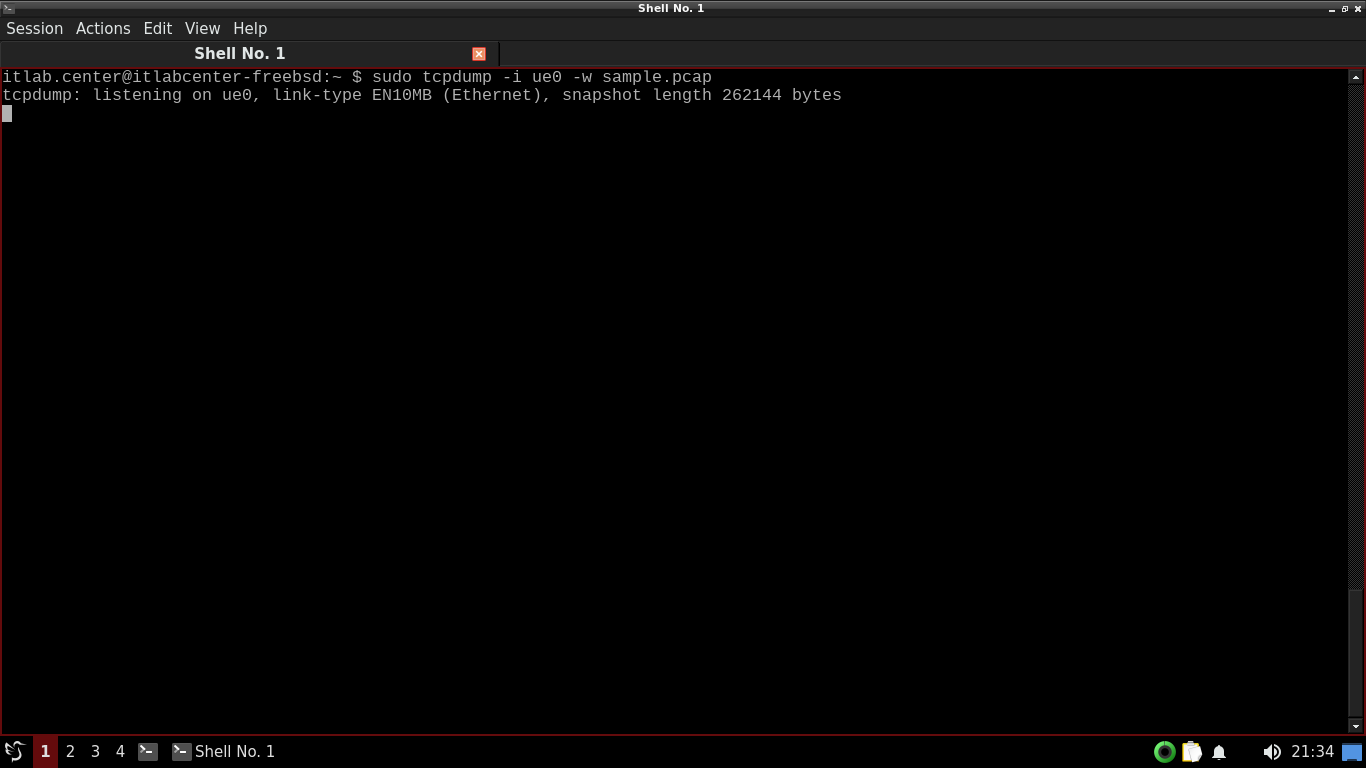
TCPDump is now listening for packets that cross out network interface, open another terminal under session
Run the following commands from the FreeBSD Qterminal to generate ICMP, HTTP, and ARP traffic for TCPDump
itlab.center@itlabcenter-freebsd:~ $ ping 8.8.8.8 -c 4
itlab.center@itlabcenter-freebsd:~ $ fetch -o /dev/null https://neverssl.com
itlab.center@itlabcenter-freebsd:~ $ sudo arp -d 192.168.0.1 && ping -c 1 192.168.0.1
Head back to our TCPDump terminal and hit CTRL+C to stop the capture, TCPDump will display a packet count
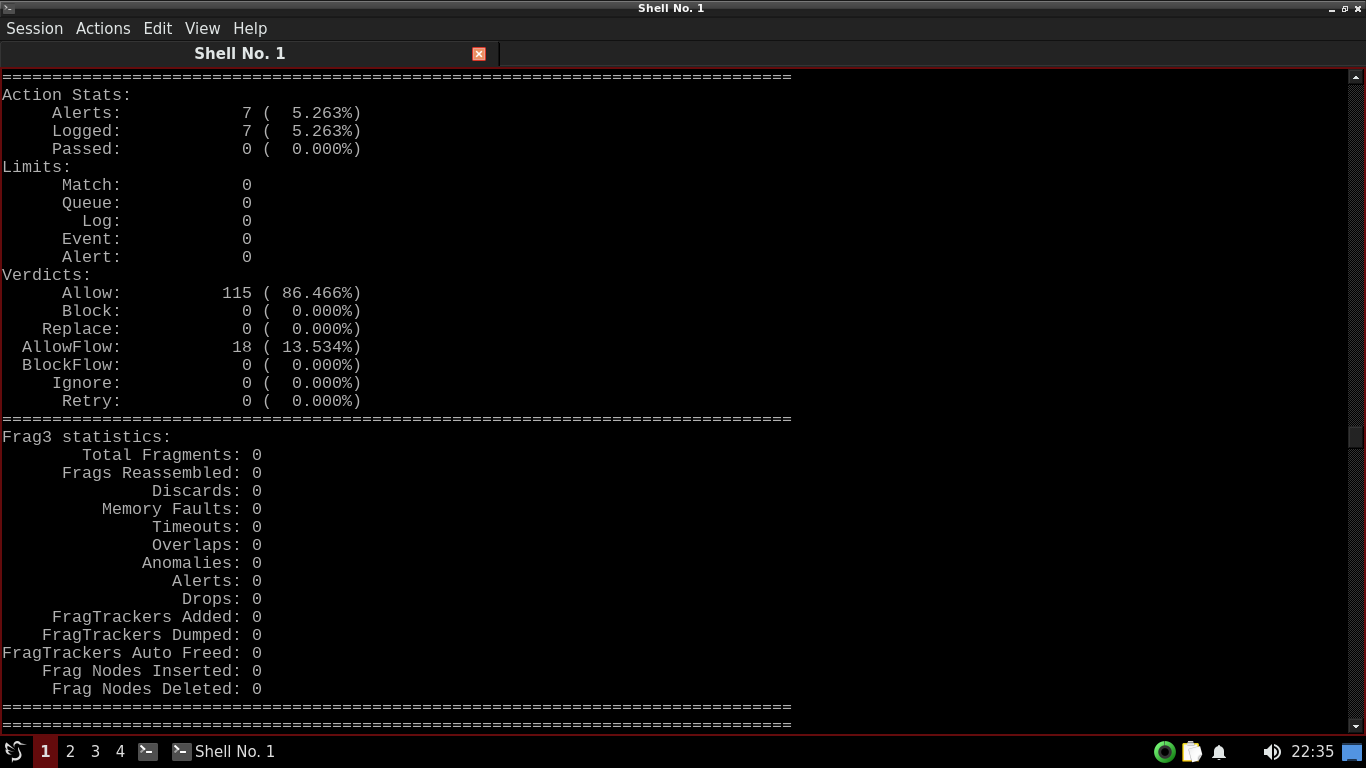
Run the following command from the FreeBSD Qterminal to instruct Snort to analyze the sample.pcap file
itlab.center@itlabcenter-freebsd:~ $ sudo snort -c /usr/local/etc/snort/snort.conf -r sample.pcap
Scroll to find the section displaying the Action Stats. Notice that no alerts were generated in this file

The reason we are seeing no alerts is because we have empty rules, so snort doesn't know what to look for
Run the following commands from the FreeBSD Qterminal to add an alert for ICMP ping commands and retest:
itlab.center@itlabcenter-freebsd:~ $ echo 'alert icmp any any -> any any (msg:"ICMP Ping Detected"; sid:1000001; rev:1;)' >> ./rules/local.rules
itlab.center@itlabcenter-freebsd:~ $ sudo snort -c /usr/local/etc/snort/snort.conf -r sample.pcap
Resulting Output:
Run the following command from the FreeBSD Qterminal to run Snort in quiet mode and show alerts real time
itlab.center@itlabcenter-freebsd:~ $ sudo snort -q -A console -c /usr/local/etc/snort/snort.conf -r sample.pcap
Resulting Output:
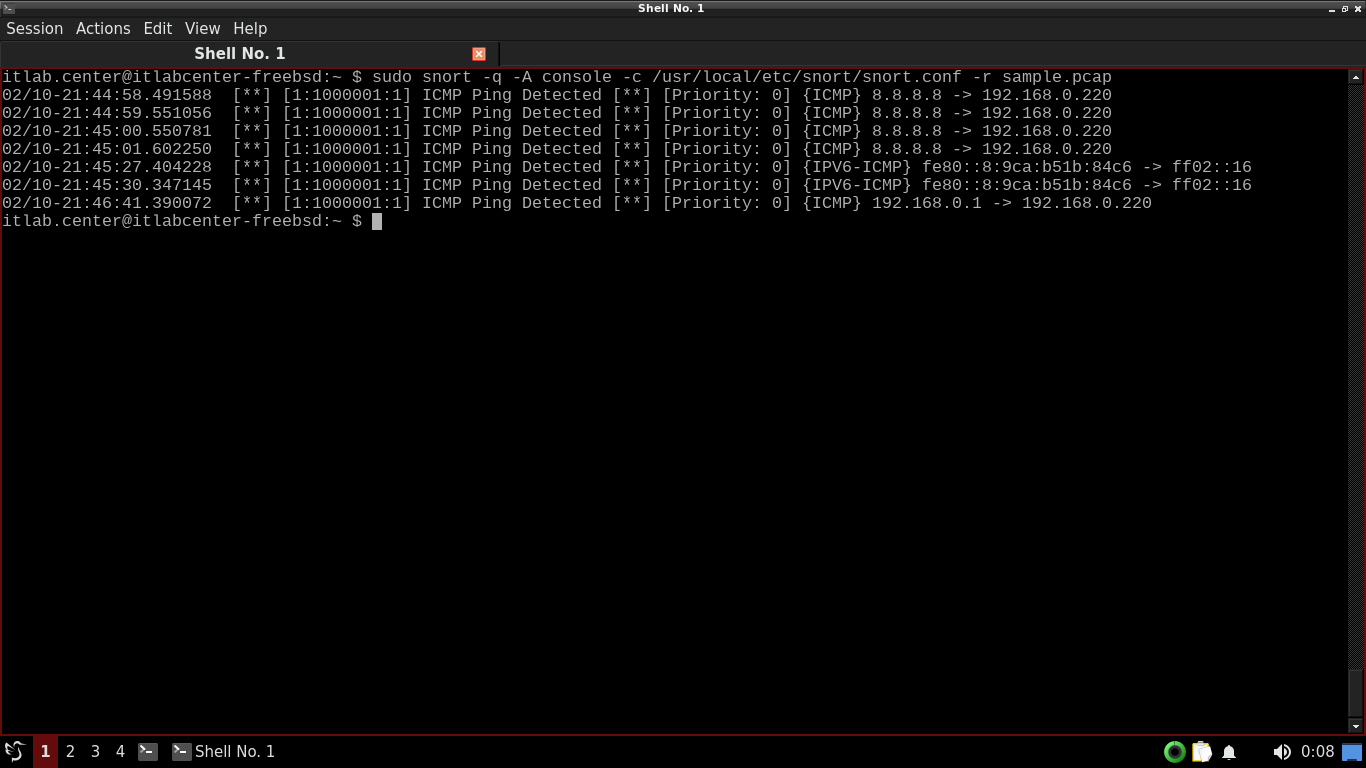
The -q option tells Snort to run in quiet mode and the -A console option tells snort to show live alerts
Great, we have the alerts listed, now what if we want to find specific alerts in a pile of many of them?
Run the following commands from the FreeBSD Qterminal to create two extremely sensitive alerting rules:
itlab.center@itlabcenter-freebsd:~ $ echo 'alert icmp any any -> any any (msg:"ICMP Destination Unreachable"; itype:3; sid:1000007; rev:1;) > ./rules/local.rules
itlab.center@itlabcenter-freebsd:~ $ echo 'alert icmp any any -> any any (msg:"ICMP Ping Detected"; itype:0; sid:1000010; rev:1;) >> ./rules/local.rules
itlab.center@itlabcenter-freebsd:~ $ echo 'alert tcp any any -> any any (msg:"TCP SYN Detected"; flags:S; sid:1000005; rev:1;) >> ./rules/local.rules
Run the following command from the FreeBSD Qterminal to start a capture and save results to a .pcap file
itlab.center@itlabcenter-freebsd:~ $ sudo tcpdump -i ue0 -w sample2.pcap
TCPDump is now listening for packets that cross out network interface, open another terminal under session
Run the following commands from the FreeBSD Qterminal to generate ICMP, TCP, and ARP traffic for TCPDump
itlab.center@itlabcenter-freebsd:~ $ sudo nmap -sn --disable-arp-ping 192.168.0.0/24
itlab.center@itlabcenter-freebsd:~ $ sudo nmap -PE --disable-arp-ping 192.168.0.0/24
itlab.center@itlabcenter-freebsd:~ $ sudo nmap -sO --disable-arp-ping 192.168.0.0/24
Head back to our TCPDump terminal and hit CTRL+C to stop the capture, TCPDump will display a packet count
Run the following command from the FreeBSD Qterminal to run Snort in quiet mode and show alerts real time
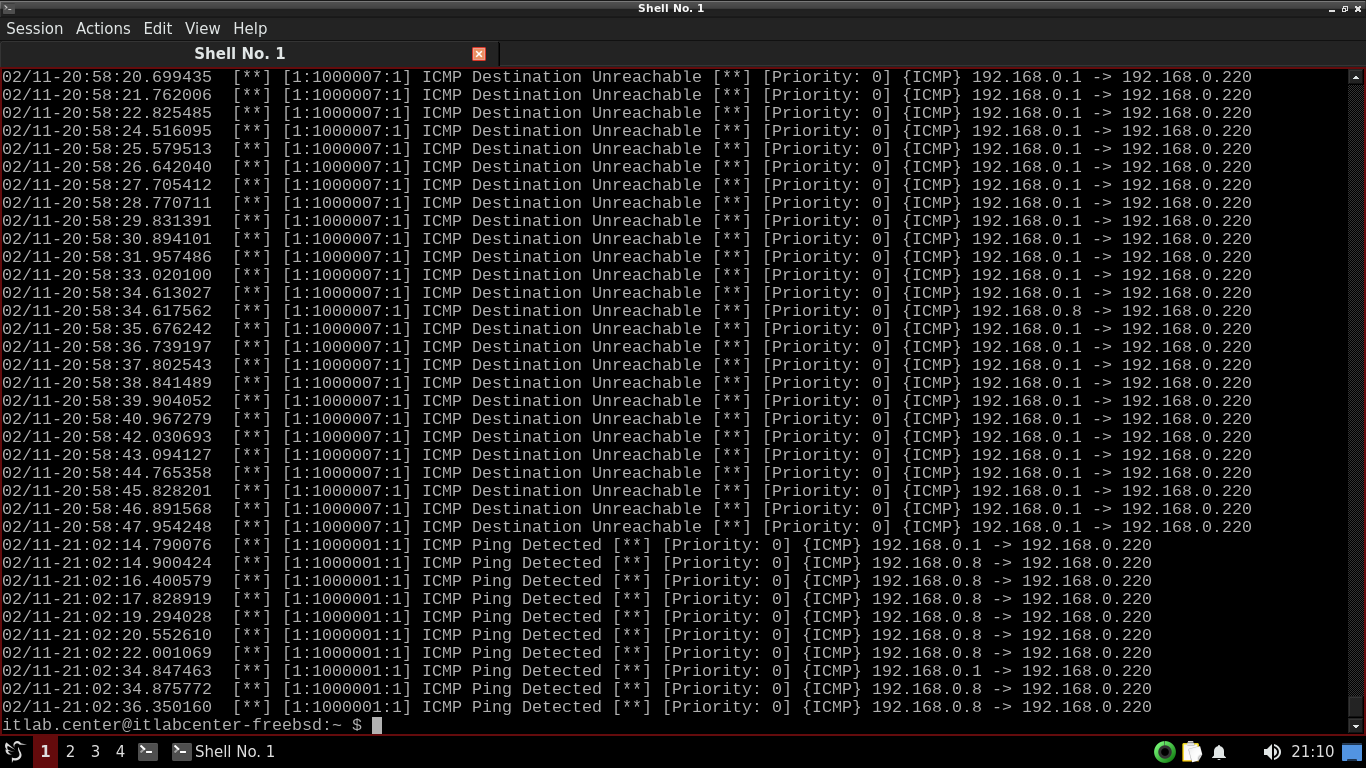
itlab.center@itlabcenter-freebsd:~ $ sudo snort -q -A console -c /usr/local/etc/snort/snort.conf -r sample2.pcap
Resulting Output:
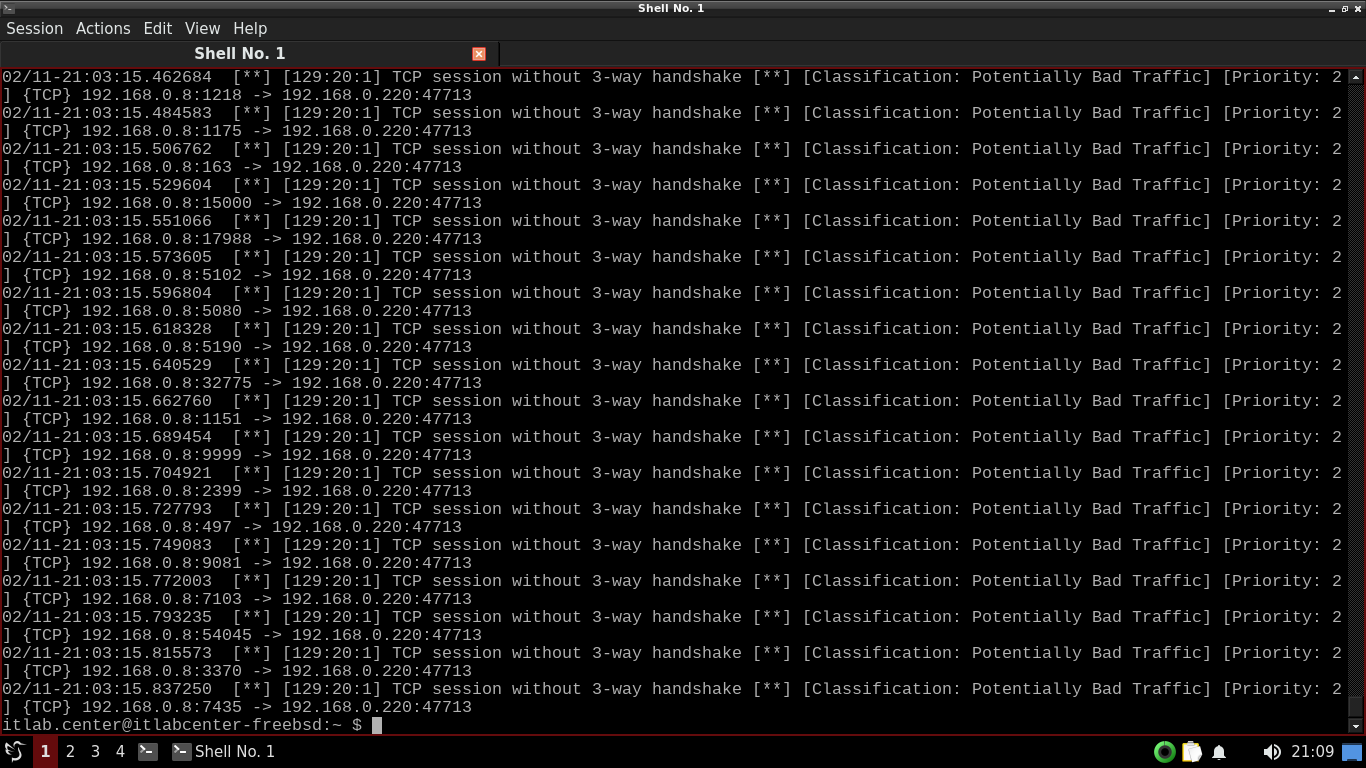
A lot of alert messages will fly by on the screen. Feel free to scroll up to review the alerts shown above
Run the following command from the FreeBSD Qterminal to start snort in quite+console mode and search ICMP
itlab.center@itlabcenter-freebsd:~ $ sudo snort -q -A console -c /usr/local/etc/snort/snort.conf -r sample2.pcap | grep ICMP
Resulting Output:
Scroll up an take not of the ICMP alerts shown. Looks like we have both PING and Destination Unreachable
Run the following command from the FreeBSD Qterminal to start snort and search for ICMP and PING fields
itlab.center@itlabcenter-freebsd:~ $ sudo snort -q -A console -c /usr/local/etc/snort/snort.conf -r sample2.pcap | grep ICMP | grep Ping
Resulting Output:
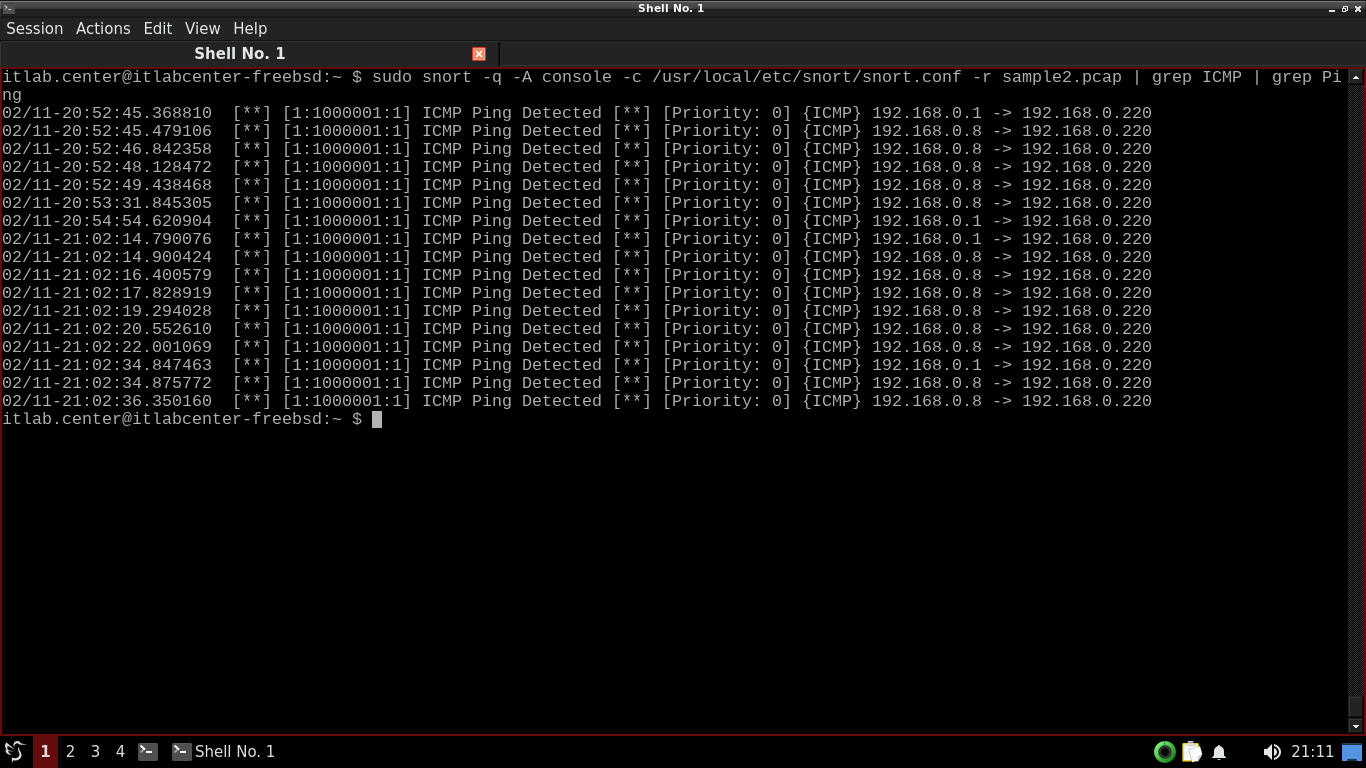
Now we see what looks like PING traffic from Nmap. We can use the wc command to count the total alerts
Run the following command from the FreeBSD Qterminal to count the number of PING alerts in sample2.pcap
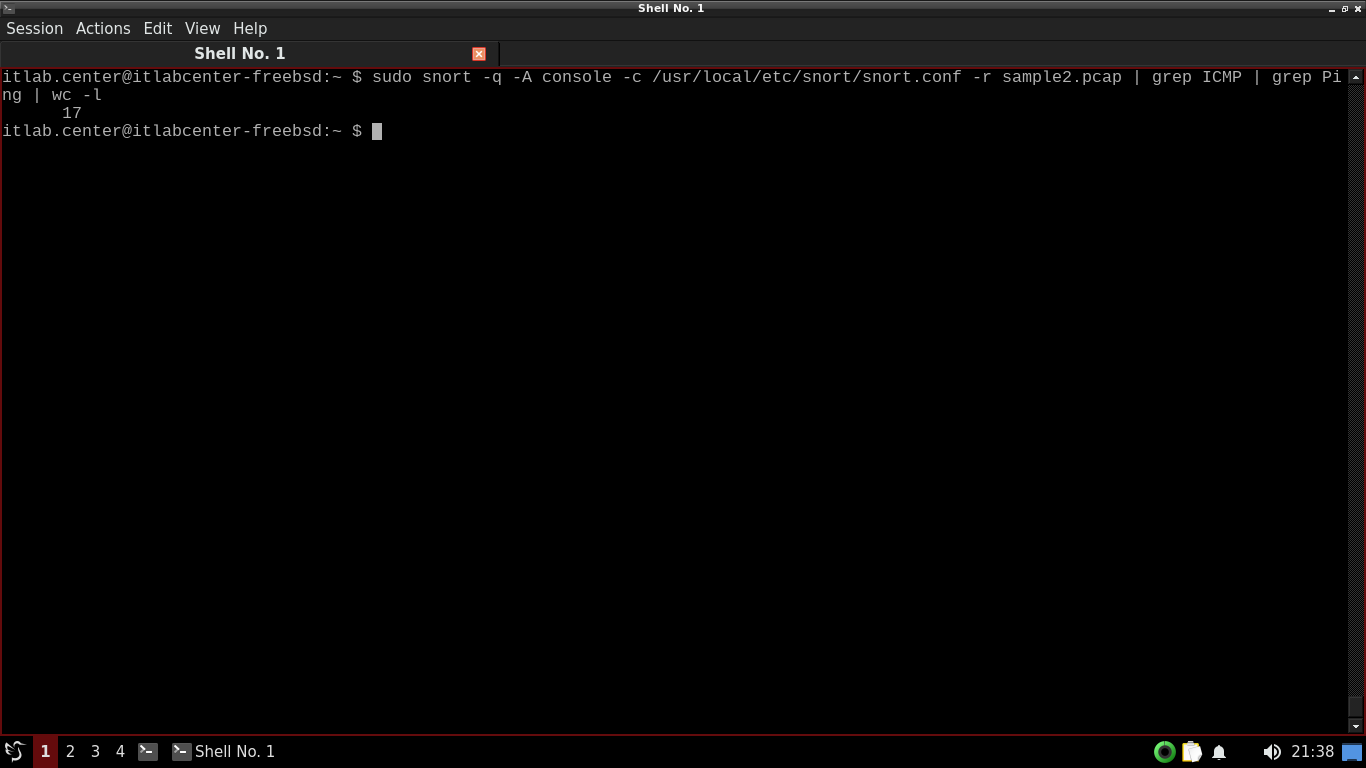
itlab.center@itlabcenter-freebsd:~ $ sudo snort -q -A console -c /usr/local/etc/snort/snort.conf -r sample2.pcap | grep ICMP | grep Ping | wc -l
Resulting Output:
By default, Snort will send its output to the screen. However, Snort can instead be set to logging mode
In logging mode, Snort will send all of its output to a number of specified log files instead of the screen
Run the following command from the FreeBSD Qterminal to open and edit the snort config file with nano:
itlab.center@itlabcenter-freebsd:~ $ sudo nano /usr/local/etc/snort/snort.conf
Find and uncomment these first two lines and add the third to configure snorts logs, then save with CTRL+O
output alert_unified2: filename snort.alert, limit 128, nostamp
output log_unified2: filename snort.log, limit 128, nostamp
output alter_fast: filename snort.alert.fast
Run the following command from the FreeBSD Qterminal to run Snort in logging mode and save to the Desktop
itlab.center@itlabcenter-freebsd:~ $ sudo snort -c /usr/local/etc/snort/snort.conf -r sample.pcap -l Desktop
Resulting Output:
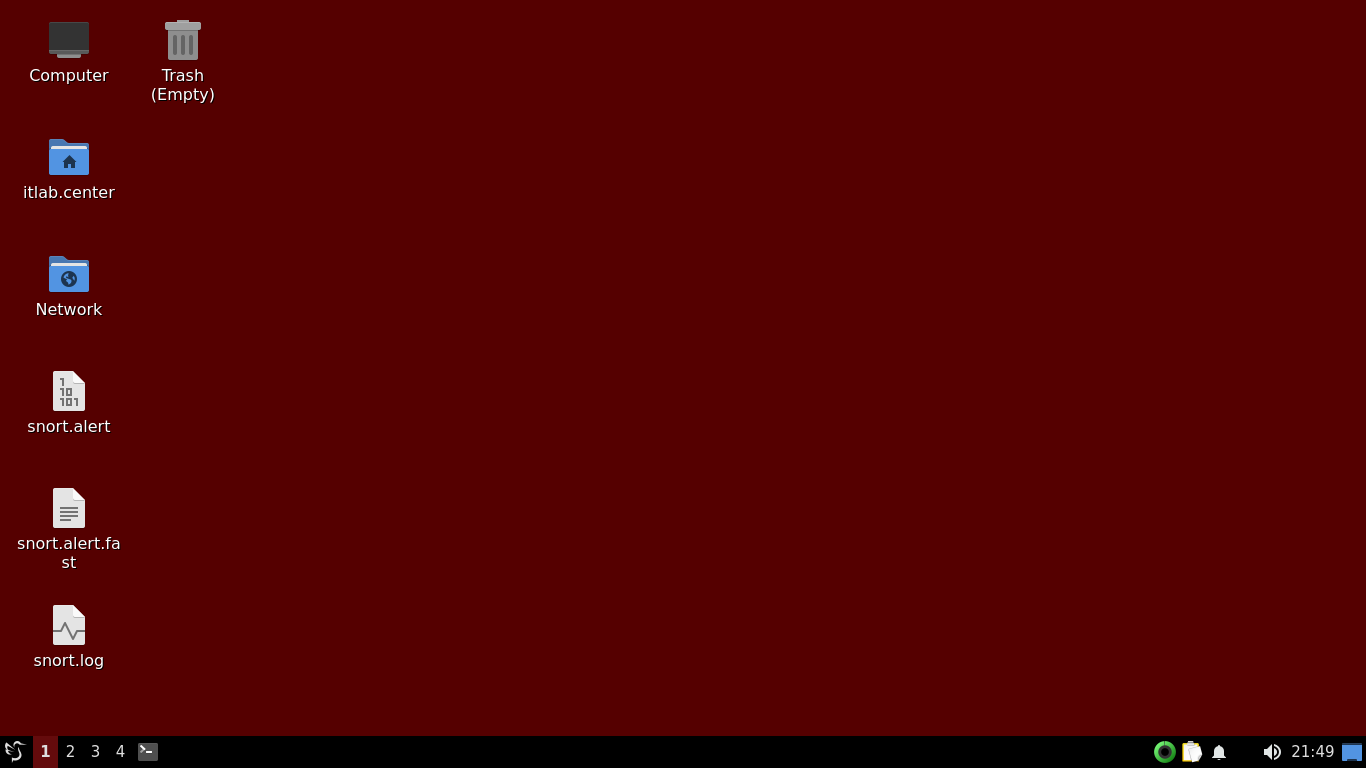
The -l switch tells Snort to save its logs in the directory specified in the command, in this case Desktop
We can see above there are three new log files on the Desktop: snort.alert.fast, snort.log and snort.alert
On the Desktop, double-click the snort.alert.fast file to open it in Featherpad and review its contents
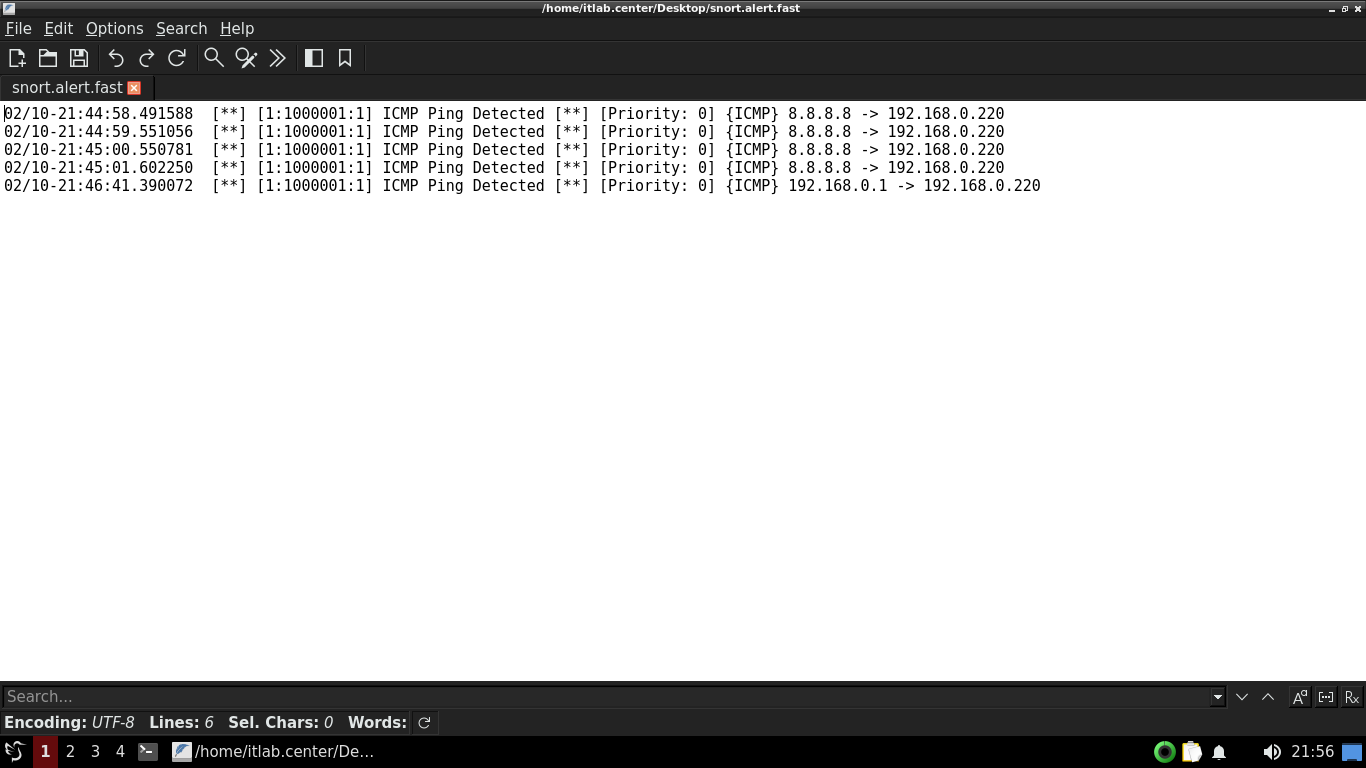
The snort.alert.fast file is a summary of our console output. Close the file and if prompted do not save
You will not be able to open the Snort.log or Snort.alert files in Featherpad or in any other text editor
That is because these files are written in "unified2" format. We will need a special tool called u2spewfoo
Run the following command from the FreeBSD Qterminal to read the snort.log file using the u2spewfoo tool
itlab.center@itlabcenter-freebsd:~ $ sudo u2spewfoo Desktop/snort.log
Resulting Output:
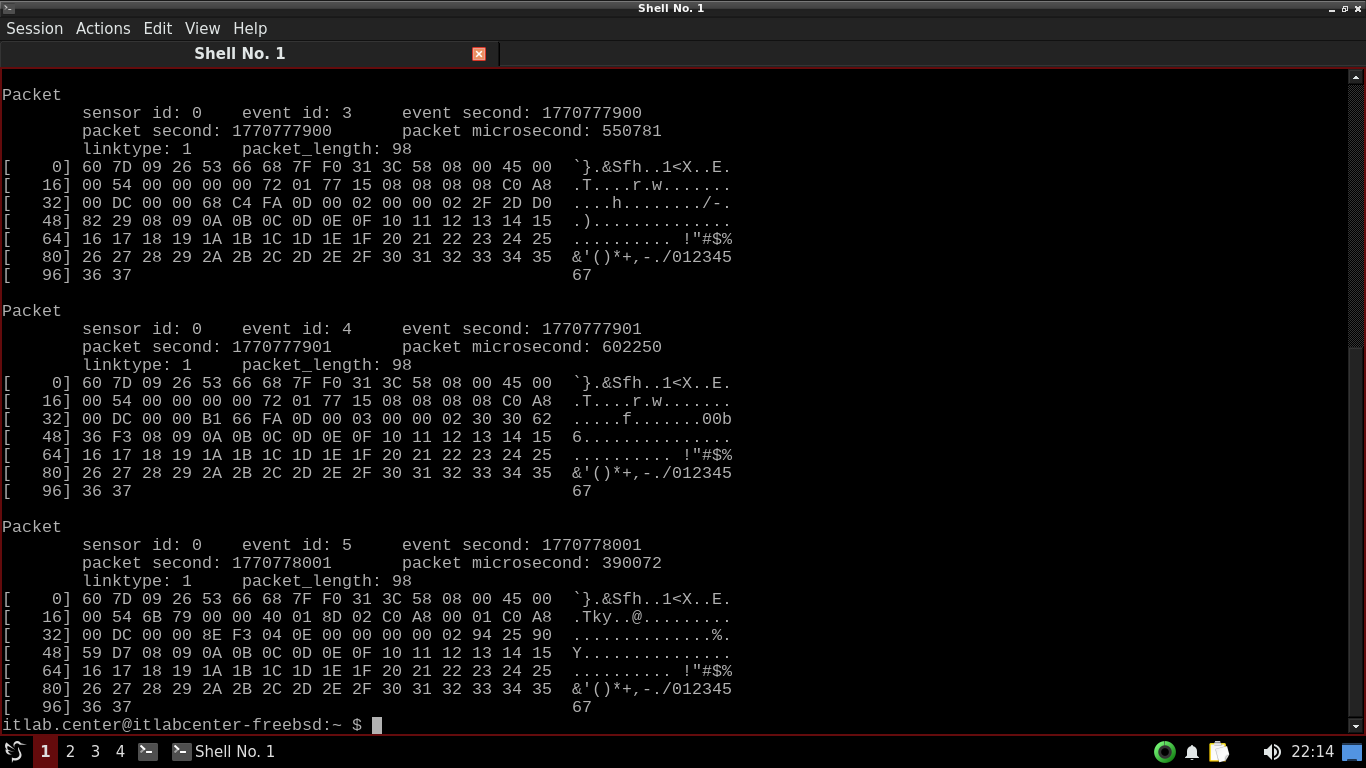
You will only see an Event header if Snort detects a rule violation. Otherwise there will only be a packet
5. Install Windows Server 2025
Windows Server is Microsoft's enterprise-grade server operating system for hosting several applications
Organizations wishing to host their web servers, databases, or file shares on Windows will utilize this
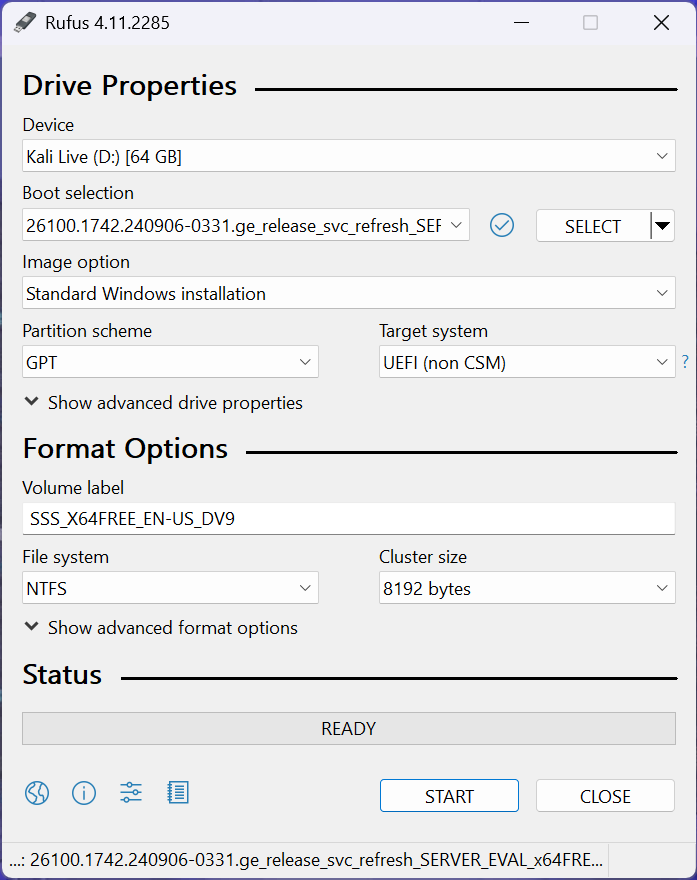
Download Windows Server 2025 Disk Image (ISO): Windows Server 2025 ISO
Download Rufus Disk Imaging Software: Rufus Official Download
In this lab exercise we will be creating alerts on FreeBSD with traffic to a second Windows Server host
Insert USB Flash Drive, run rufus.exe, select target drive, select Windows Server 2025 ISO, hit start:
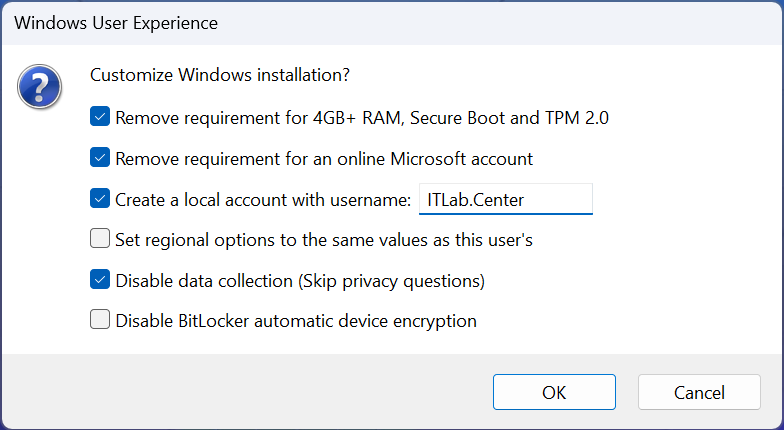
Use the rufus popup menu to customize the Windows Server 2025 installation and disable data collection:
Remove USB Flash Drive and Insert into unused PC. Start the PC and press the hot boot key at the startup:
Navigate through the installer and select the Windows Server Standard Evaluation Desktop Experience option:
We now have our Server provisioned which will simulate our Group Policy for the following lab sections
6. Add & Test Snort Rules
In this part of the lab, you will add new local rules for Snort and generate traffic to test these rules
Snort rules can look a little strange at first, but the basic syntax is actually pretty straightforward
A Snort rules is made up of a header section and an options section. The header section reads a bit like
a firewall rule, and the options section can be as simple as a message and a sid (a unique identifier)
• Header: alert tcp 10.10.10.1 any -> 10.10.10.100 21
• Options: (msg:"User has accessed FTP"; sid:00001;)
In the above example, Snort will alert when host 10.10.10.1 tries to touch TCP port 21 on 10.10.10.100
Notice the -> which is the unidirectional flow indicator. The source is left and the destination is right
The message (msg) is simply what gets logged when this alert happens. You can write any message you want
but it should be related to the traffic rule. The sid can be any numeric value, as long as it is unique
The options section can contain many more criteria for alerting traffic. There are general options that
provide additional context for a given rule, payload options that set payload-specific criteria, and post
detection options to take actions on a given packet after the rule has "fired". If you have seen snort
rules in the past, then you know that the options section can get pretty involved and complex at times
With that in mind, we will try to keep the options used in this lab fairly simple for learning purposes
To alert on both the sent and received traffic, you can use these two unidirectional rules listed below:
• alert tcp any any -> any 25 (msg:"Traffic to SMTP Server Detected"; sid:00002;)
• alert tcp any 25 -> any any (msg:"Traffic from SMTP Server Detected"; sid:00003;)
In the above example, Snort will detect TCP from any source and port to any destination and port for SMTP
Then the second rule above will detect TCP from any source using SMTP to any destination using any port
It is also possible to use a bidirectional flow indicator. When you use a bidirectional flow indicator,
Snort will treate both the left and right sides as both the source and the destination of network traffic
• alert tcp any any <> any 25 (msg:"SMTP Traffic Detected"; sid:00002;)
This way, Snort will detect TCP from any source with SMTP to any destination using any port and vice versa
So why not make all rules bidirectional? Unidirectional rules are more granular, less resource intensive
and generate few false positives than bidirectional rules. You should use the unidirectional rules when
traffic has a clear initiator and target. Most of the time we only want to alert when an unauthorized port
is used or malicious content is found. In most cases, we don't need to alert on the actual return traffic
Bidirectional rules are good on things like C2 traffic where we care if the client is pinged by the server
Snort's real power comes from its ability to alert on the payload of a packet, here is an example of this
• alert tcp any any -> (msg:"Botnet Detected"; content:"|5a 4f 4f 4d 00 00|"; sid:00002;)
In this example, we are using the content option to find the hex string "5a 4f 4f 4d 00 00" in any traffic
This string's presence indicates that the Zeus botnet exists on your network and should thus be altered
Now that we have a better understanding of Snort rules, let's create and test our own rules with a host
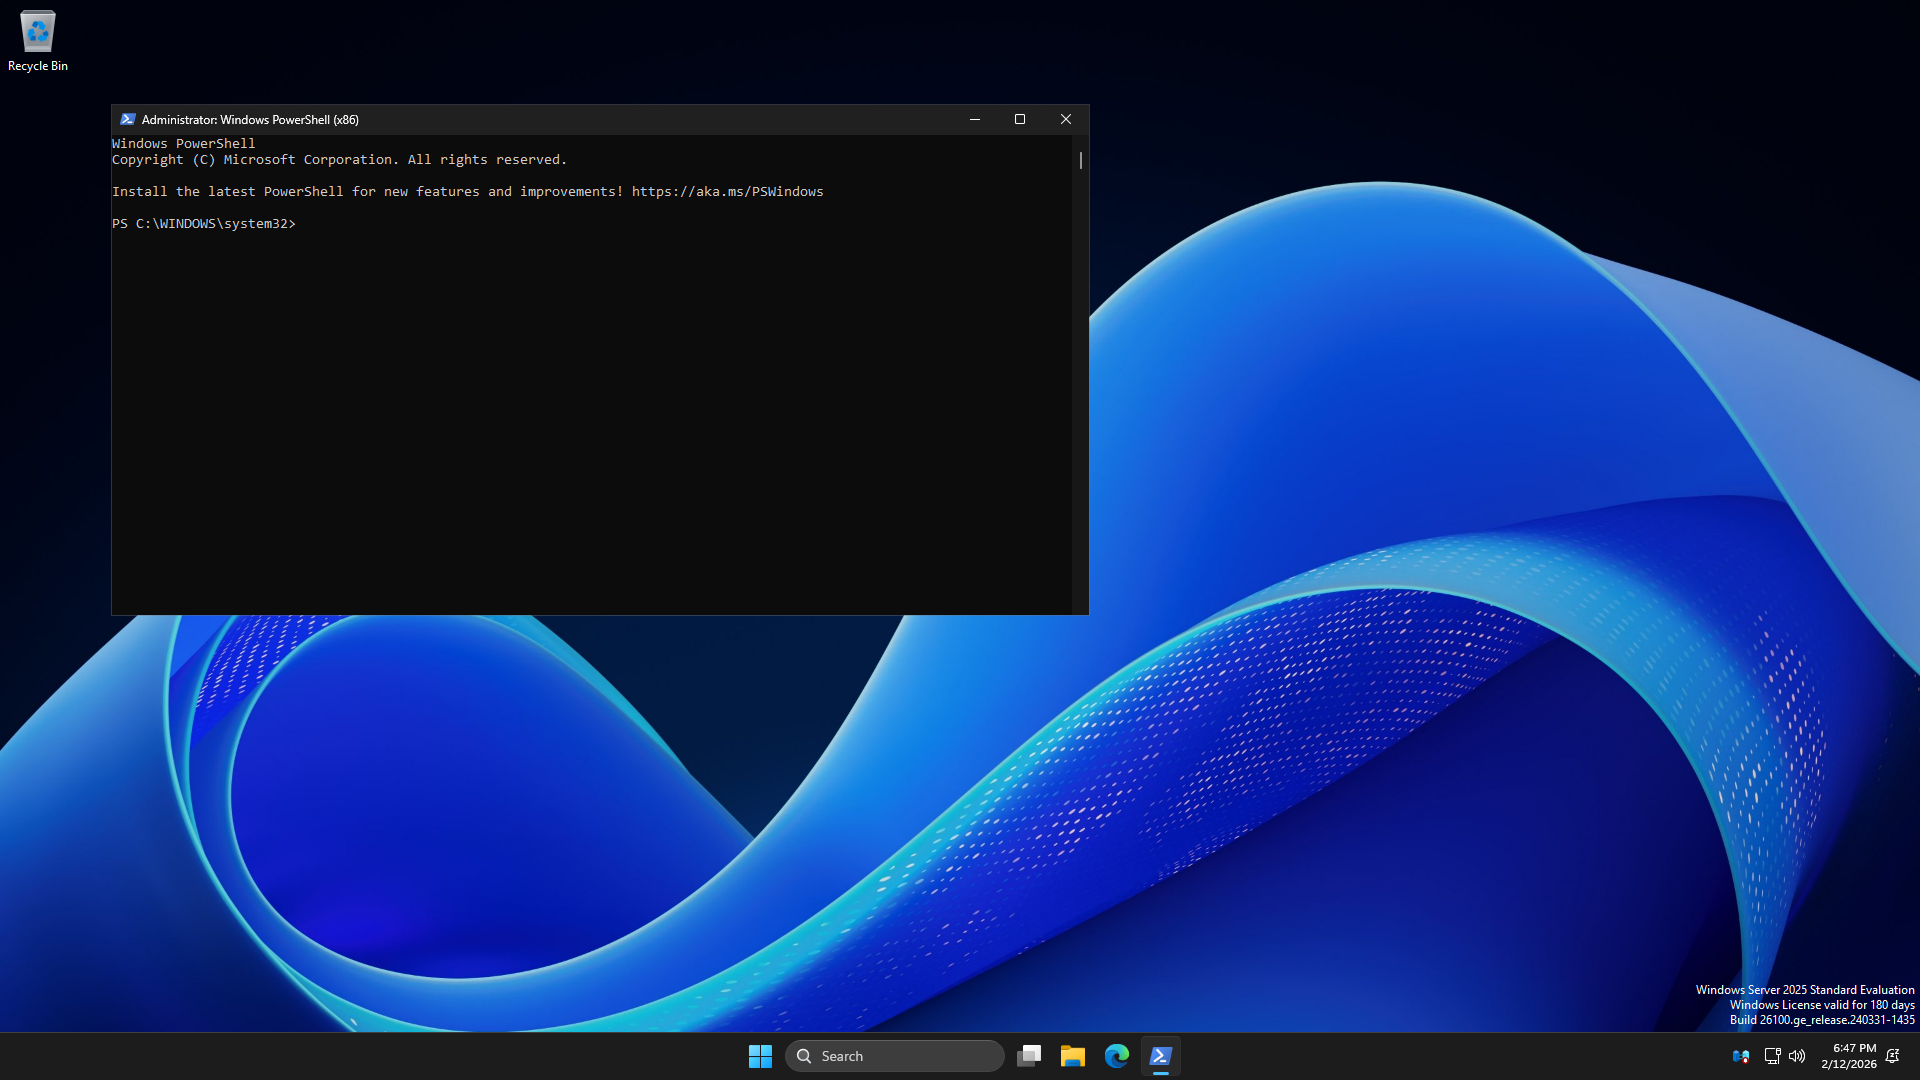
From the Windows Server, on the taskbar, search for PowerShell and select the option to run as an Admin
Run the following command from the Windows Administrator Powershell to view the hosts Local IP Address:
PS C:\WINDOWS\system32> ipconfig
Resulting Output:
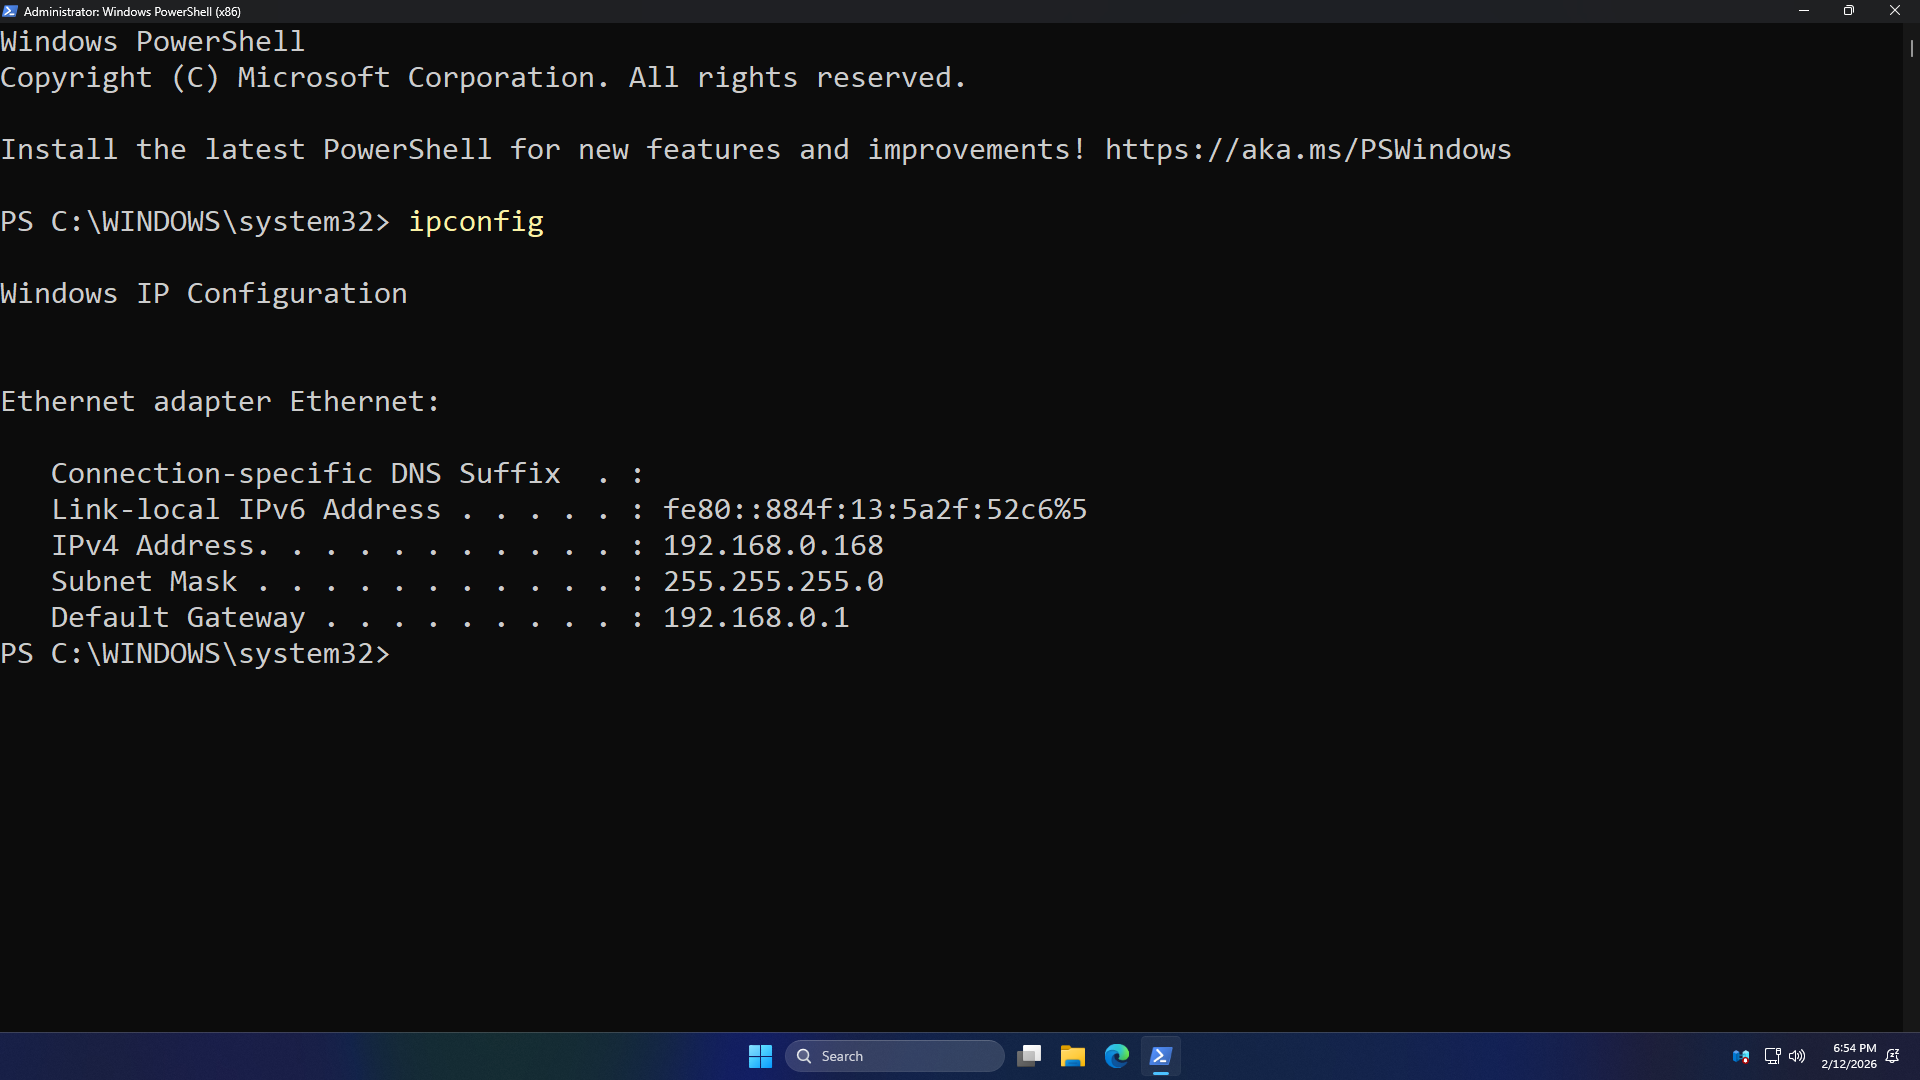
Take note of the IP Address displayed above for our Windows Server. You will use it throughout this lab
Run the following commands from the Windows Administrator PowerShell to install the Nmap network scanner
PS C:\WINDOWS\system32> $url = "https://nmap.org/dist/nmap-7.95-setup.exe"
PS C:\WINDOWS\system32> $output = "$env:TEMP\nmap-setup.exe"
PS C:\WINDOWS\system32> Invoke-WebRequest -Uri $url -OutFile $output
PS C:\WINDOWS\system32> Start-Process -FilePath $output -Wait
PS C:\WINDOWS\system32> Remove-Item $output
Run the following command from the Windows Administrator PowerShell to ensure the PCs firewall is disabled
PS C:\WINDOWS\system32> Set-NetFirewallProfile -Profile Domain,Public,Private -Enabled False
The netcat listener which comes bundled with Nmap can only listen on one TCP port at a time, we need three
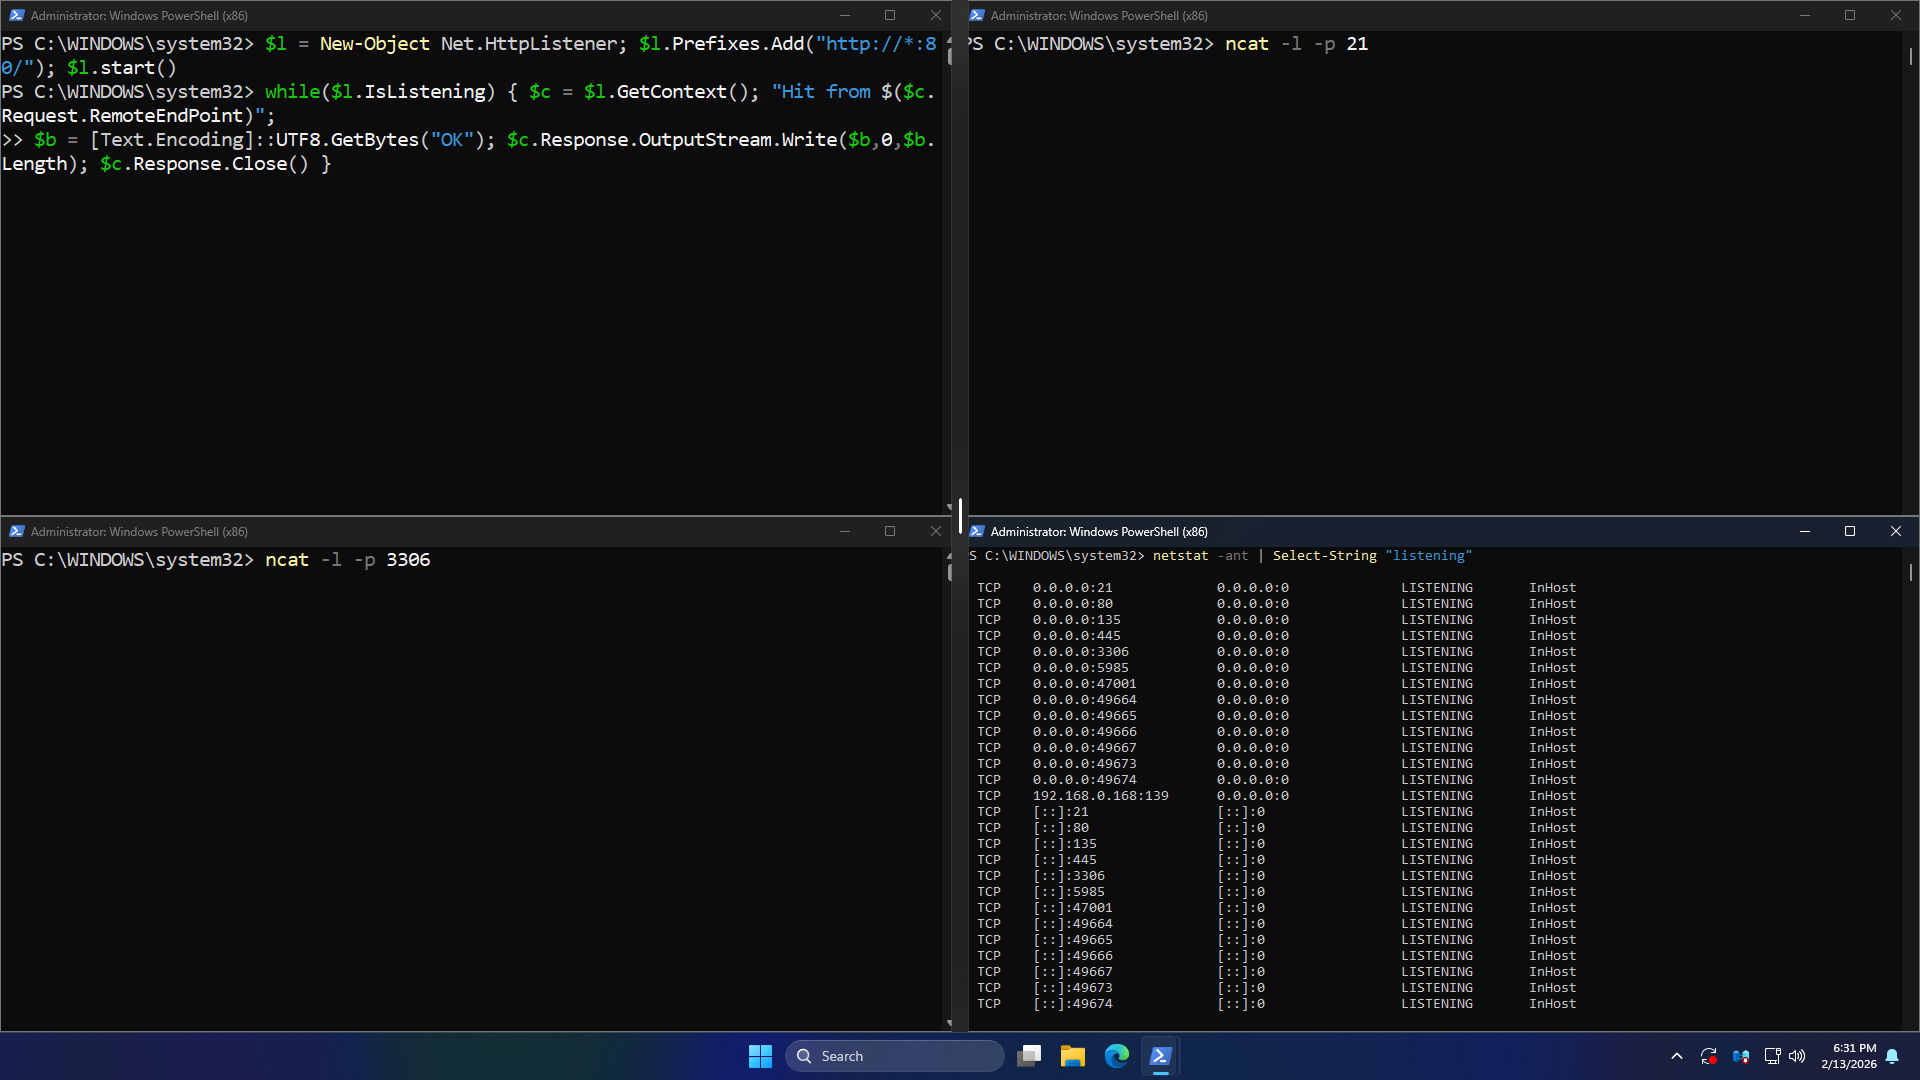
Run the following commands from the Windows Administrator PowerShell to make a web server with HTTPListener
PS C:\WINDOWS\system32> $l = New-Object Net.HttpListener; $l.Prefixes.Add("http://*:80/"); $l.Start()
PS C:\WINDOWS\system32> while($l.IsListening) { $c = $l.GetContext(); "Hit from $($c.Request.RemoteEndPoint)";
>> $b = [Text.Encoding]::UTF8.GetBytes("OK"); $c.Response.OutputStream.Write($b,0,$b.Length); $c.Response.Close() }
Run each of the following commands from a separate Windows Administrator PowerShell to simulate services
PS C:\WINDOWS\system32> ncat -l -p 21
PS C:\WINDOWS\system32> ncat -l -p 3306
Run the following command from a fourth Windows Administrator PowerShell to view all the open TCP ports
PS C:\WINDOWS\system32> netstat -ant | Select-String "listening"
Resulting Output:
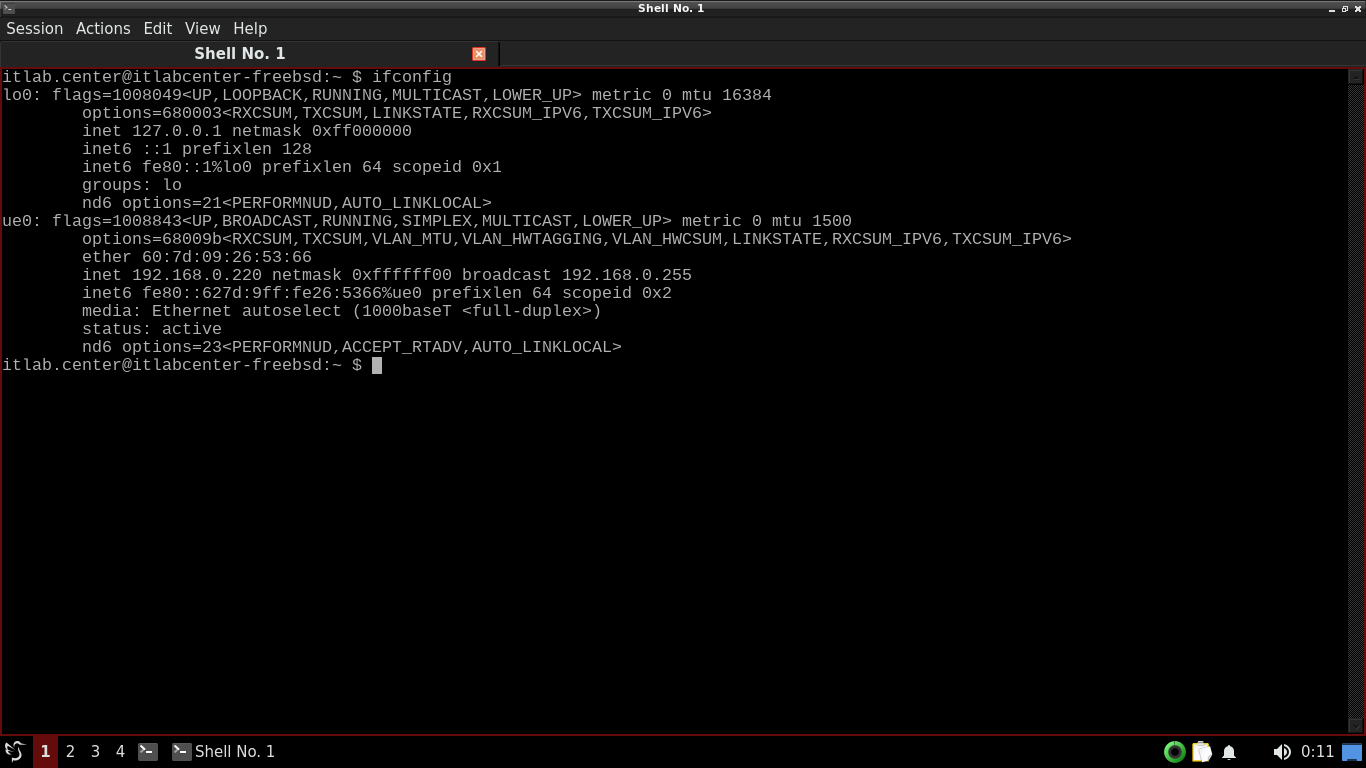
Run the following command from the FreeBSD Qterminal to display host IP Address and interface information
itlab.center@itlabcenter-freebsd:~ $ ifconfig
Resulting Output:
Run the following commands from the FreeBSD Qterminal to empty out our rules file and edit it with nano
itlab.center@itlabcenter-freebsd:~ $ echo "" > ./rules/local.rules
itlab.center@itlabcenter-freebsd:~ $ nano ./rules/local.rules
From the Nano text editor add the following line below. Save your changed with CTRL+O and exit with CTRL+X
alert icmp any any <> any any (msg:"Ping Detected"; sid:1;)
Run the following command from the FreeBSD Qterminal to start snort in listener mode on the ue0 interface
itlab.center@itlabcenter-freebsd:~ $ sudo snort -q -A console -c ./rules/local.rules -i ue0 -k none
The -i option tells Snort which interface to listen for traffic on, we combine this with our console feed
In this case, we have specified the name of the primary network interface we noted from ifconfig earlier
Notice that we direct Snort to use only the ./rules/local.rules file, avoiding all our other rules files
Telling Snort to avoid snort.conf and to only use the local.rules file is good to test rules in isolation
Run the following command from another FreeBSD Qterminal to generate ICMP traffic towards the Windows host
itlab.center@itlabcenter-freebsd:~ $ ping -c 4 192.168.0.168
Resulting Output:
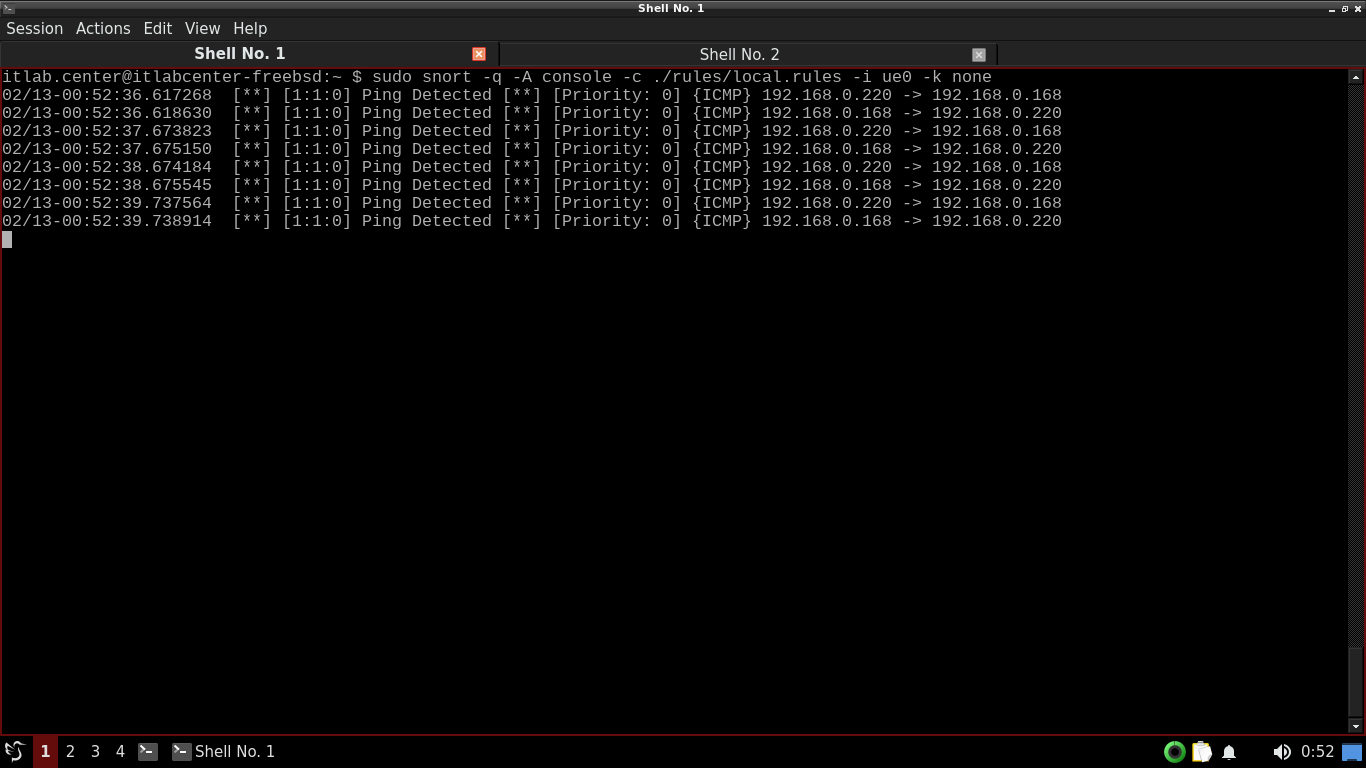
Notice the Ping Detected alerts in the terminal window running Snort and that we see requests and replies
Use CTRL+C to stop the snort command. Now let's add some additional rules using the nano text editor again
In Nano, add the following lines to the bottom of the local.rules file under ICMP to detect web traffic
alert tcp any any -> any 80 (msg:"Traffic to Insecure Web Server Detected"; sid:2;)
alert tcp any 80 -> any any (msg:"Traffic from Insecure Web Server Detected"; sid:3;)
Run the following command from the FreeBSD Qterminal to start snort in listener mode on the ue0 interface
itlab.center@itlabcenter-freebsd:~ $ sudo snort -q -A console -c ./rules/local.rules -i ue0 -k none
Run the following command from another FreeBSD Qterminal to generate HTTP traffic towards the Windows host
itlab.center@itlabcenter-freebsd:~ $ wget http://192.168.0.168
Resulting Output:
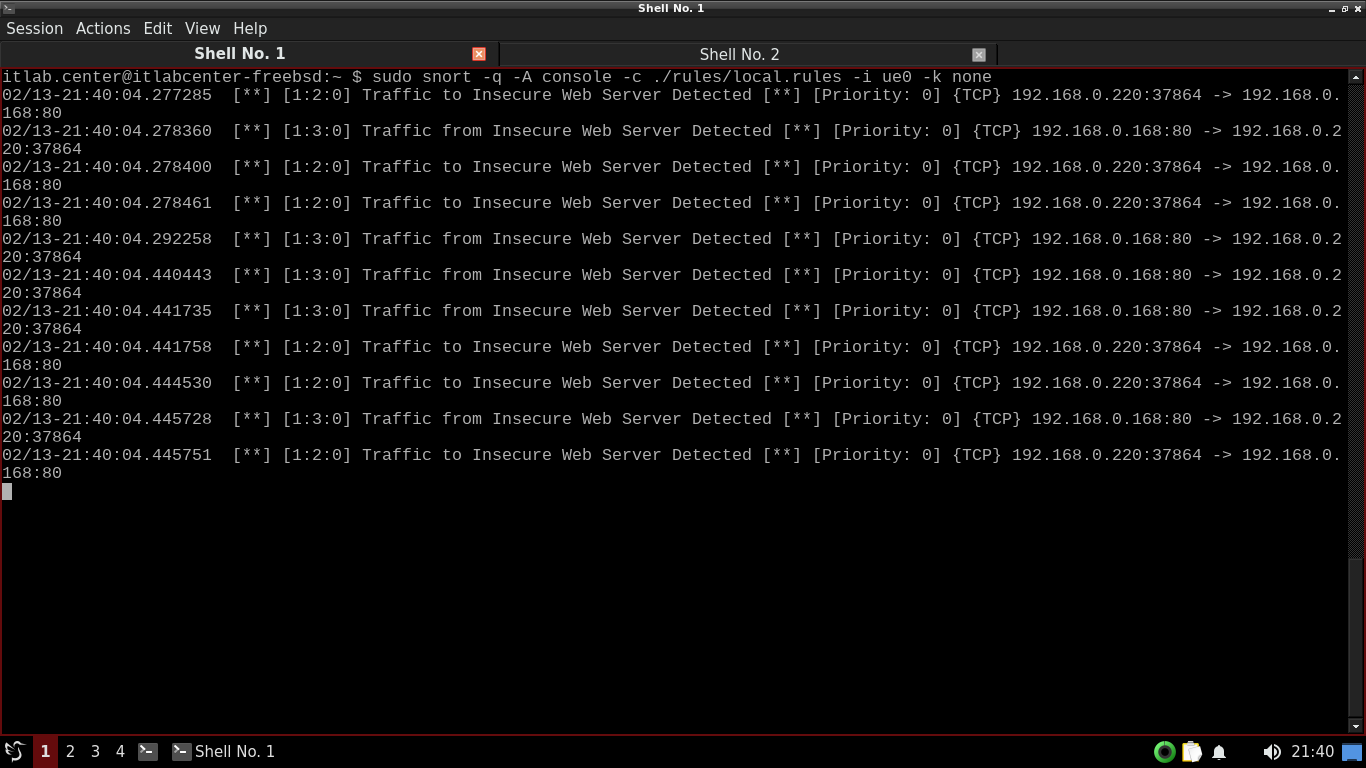
In the terminal window running Snort, Snort detects and alerts on the web traffic to and from our Windows
Notice that Snort alerts of traffic to the web service first, then alerts on the return packets afterwards
Use CTRL+C to stop the snort command. Now let's change up our created rules to create a bidirectional flow
Using Nano, change the rules we just created to match the rules below, enabling a bidirectional rule flow
alert tcp any any <> any 80 (msg:"Insecure Web Traffic Detected"; sid:2;)
#alert tcp any 80 -> any any (msg:"Traffic from Insecure Web Server Detected"; sid:3;)
We are commenting out the third rule and changing the second rule to enable a bidirectional ruleset flow
Run the following command from the FreeBSD Qterminal to start snort in listener mode on the ue0 interface
itlab.center@itlabcenter-freebsd:~ $ sudo snort -q -A console -c ./rules/local.rules -i ue0 -k none
Run the following command from another FreeBSD Qterminal to generate HTTP traffic towards the Windows host
itlab.center@itlabcenter-freebsd:~ $ wget http://192.168.0.168
Resulting Output:
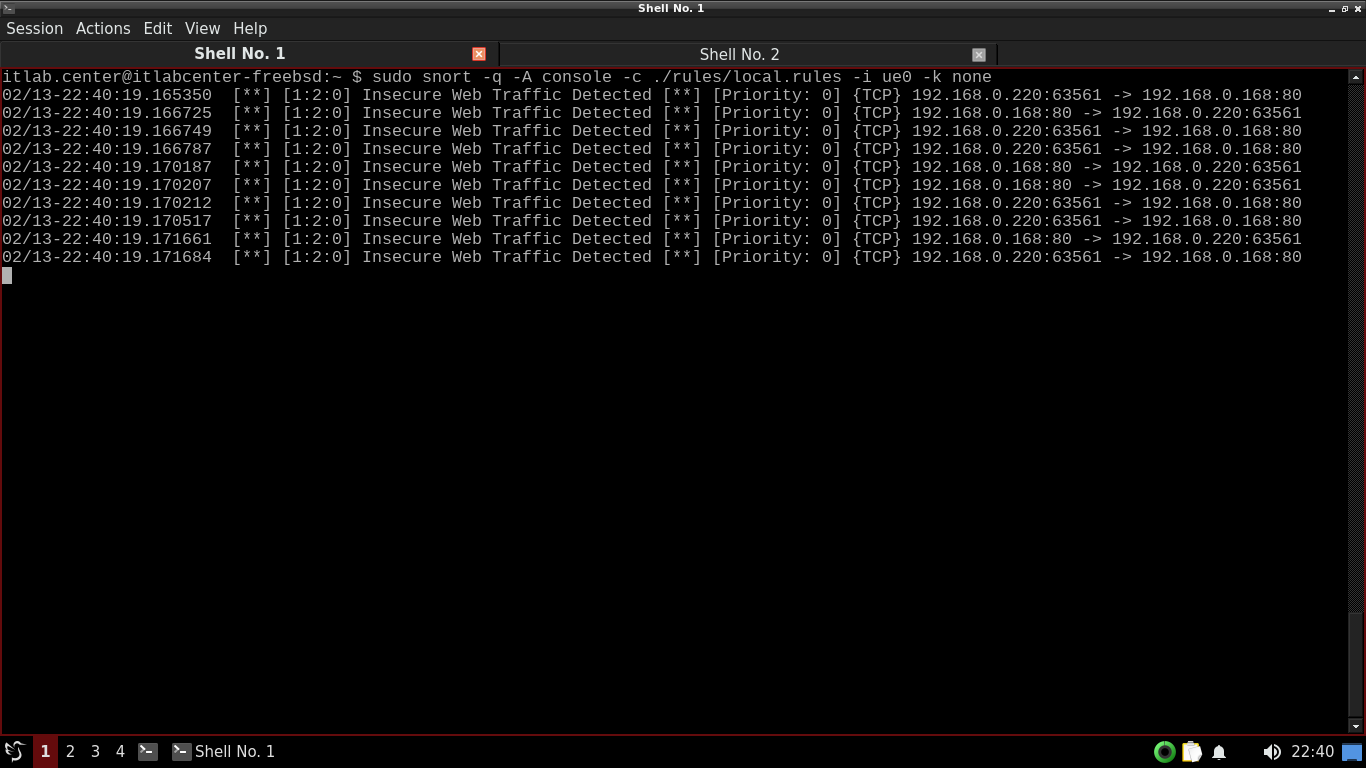
Notice we see the same output using a single bidirectional rules as we did using two unidirectional rules
Use CTRL+C to stop the snort command. Now let's change up our created rules to add FTP detection alerting
Using Nano, change the last two rules we created to match the rules below, enabling FTP detection alerts
alter tcp any any -> any 80 (msg:"Traffic to Insecure Web Server Detected"; sid:2;)
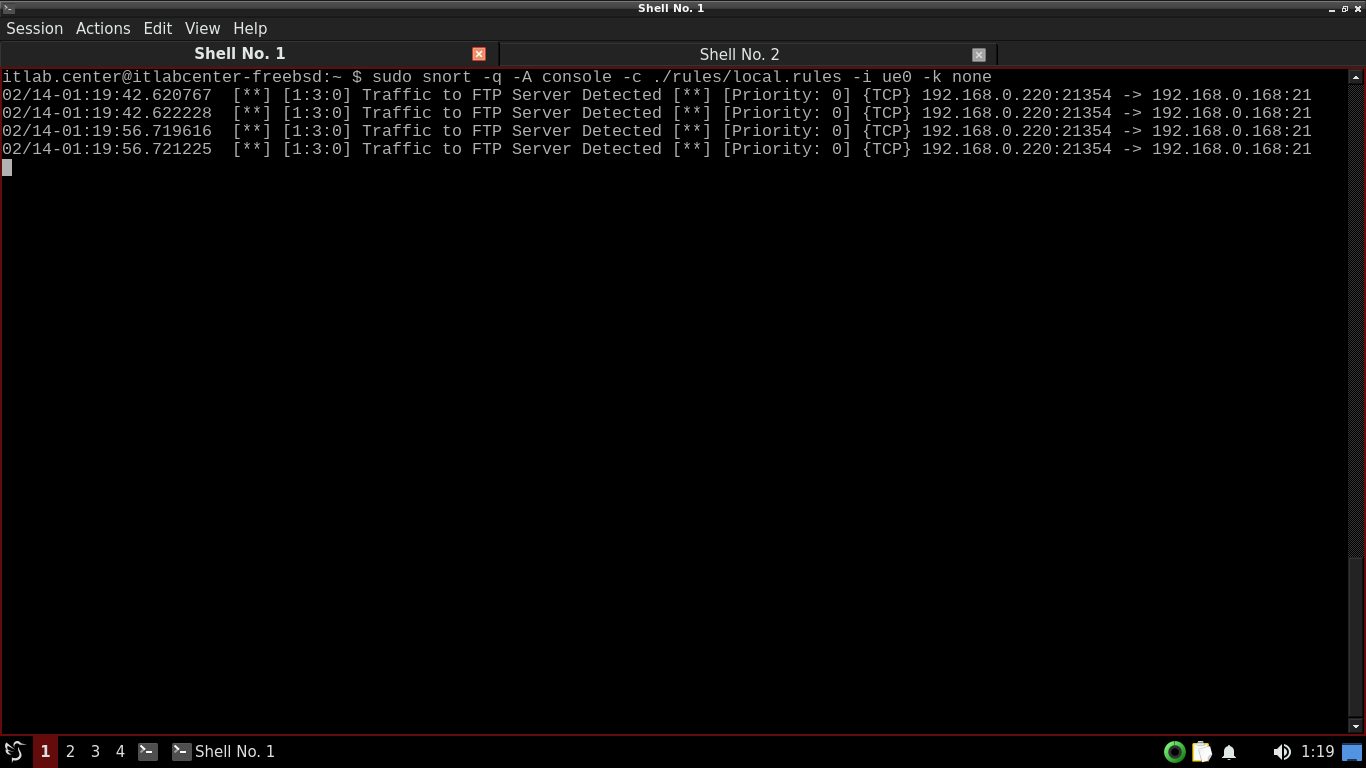
alert tcp any any -> any 21 (msg:"Traffic to FTP Server Detected"; sid:3;)
We are changing the second rule to use a unidirectional flow, and changing the third rule for FTP port 21
Run the following command from the FreeBSD Qterminal to start snort in listener mode on the ue0 interface
itlab.center@itlabcenter-freebsd:~ $ sudo snort -q -A console -c ./rules/local.rules -i ue0 -k none
Run the following command from another FreeBSD Qterminal to generate FTP traffic towards the Windows host
itlab.center@itlabcenter-freebsd:~ $ ftp 192.168.0.168
When the connection is made, hit CTRL+C to terminate it. Do this a few times to generate some FTP alerts
Use CTRL+C to stop the snort command. Now let's change up our created rules to add MySQL detection alerts
Using Nano, add the following below as a fourth alert to our rules file to generate alerts for MySQL pings
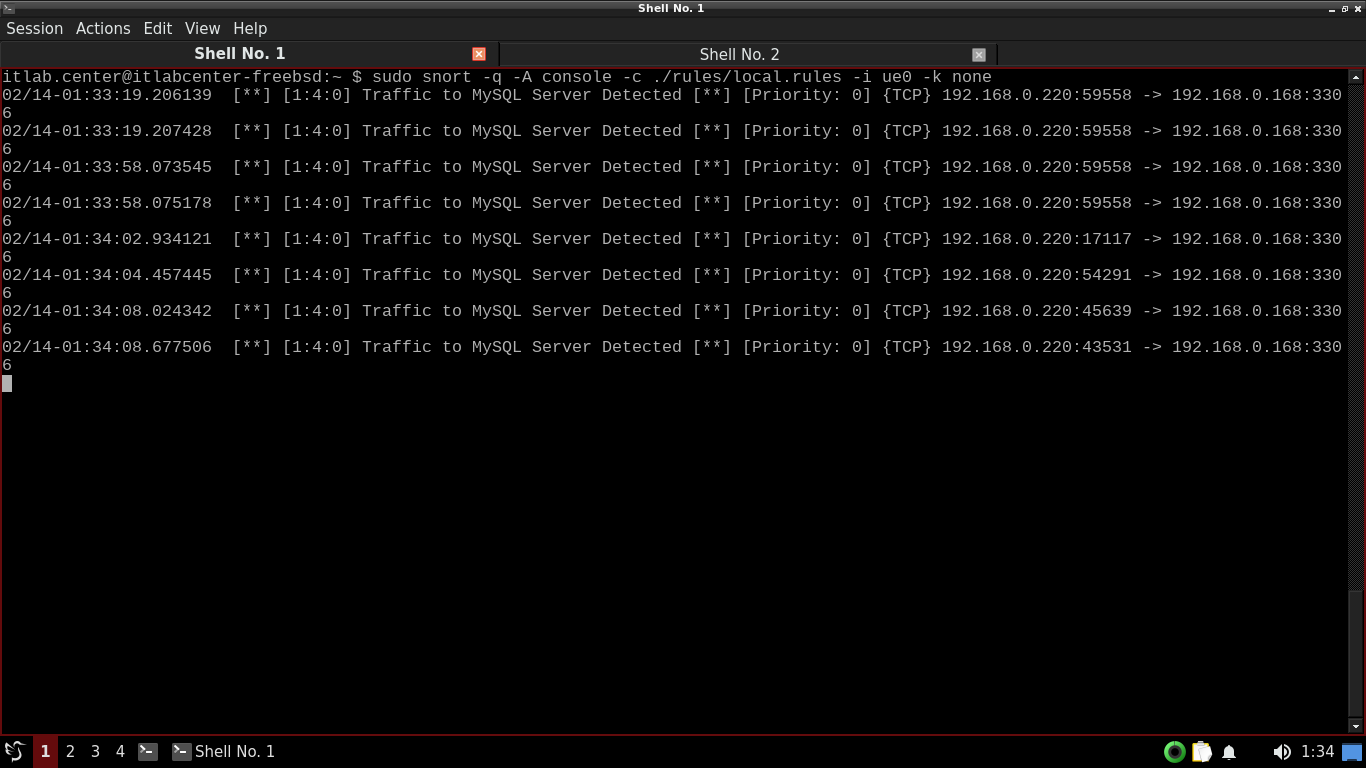
alert tcp any any -> any 3306 (msg:"Traffic to MySQL Server Detected"; sid:4;)
Run the following command from the FreeBSD Qterminal to start snort in listener mode on the ue0 interface
itlab.center@itlabcenter-freebsd:~ $ sudo snort -q -A console -c ./rules/local.rules -i ue0 -k none
Run the following command from another FreeBSD Qterminal to generate MySQL traffic towards the Windows host
itlab.center@itlabcenter-freebsd:~ $ mysql -h 192.168.0.168
When the connection is made, hit CTRL+C to terminate it. Do this a few times to generate some MySQL alerts
Before we wrap this lab up, let's revisit analyzing PCAP files with snort so we can see how Nmap scans look
We will test our new rules against a tcpdump capturing an Nmap TCP connect scan across the entire network
Using Nano, edit the rules file to change each of our rules to a bidirectional flow as demonstrated below
alert tcp any any <> any 80 (msg:"Traffic to Insecure Web Server Detected"; sid:2;)
alert tcp any any <> any 21 (msg:"Traffic to FTP Server Detected" sid:3;)
alert tcp any any <> any 3306 (msg:"Traffic to MySQL Server Detected" sid:4;)
Run the following command from the FreeBSD Qterminal to start a capture and save results to a .pcap file
itlab.center@itlabcenter-freebsd:~ $ sudo tcpdump -i ue0 -w sample3.pcap
TCPDump is now listening for packets that cross our network interface, open another terminal under session
Run the following command from the FreeBSD Qterminal to perform an Nmap TCP connect scan without ARP pings
itlab.center@itlabcenter-freebsd:~ $ nmap -Pn --disable-arp-ping 192.168.0.0/24
Head back to our TCPDump terminal and hit CTRL+C to stop the capture, TCPDump will display a packet count
Run the following command from the FreeBSD Qterminal to instruct Snort to analyze the sample3.pcap file
itlab.center@itlabcenter-freebsd:~ $ sudo snort -q -A console -c ./rules/local.rules -r sample3.pcap
Resulting Output:
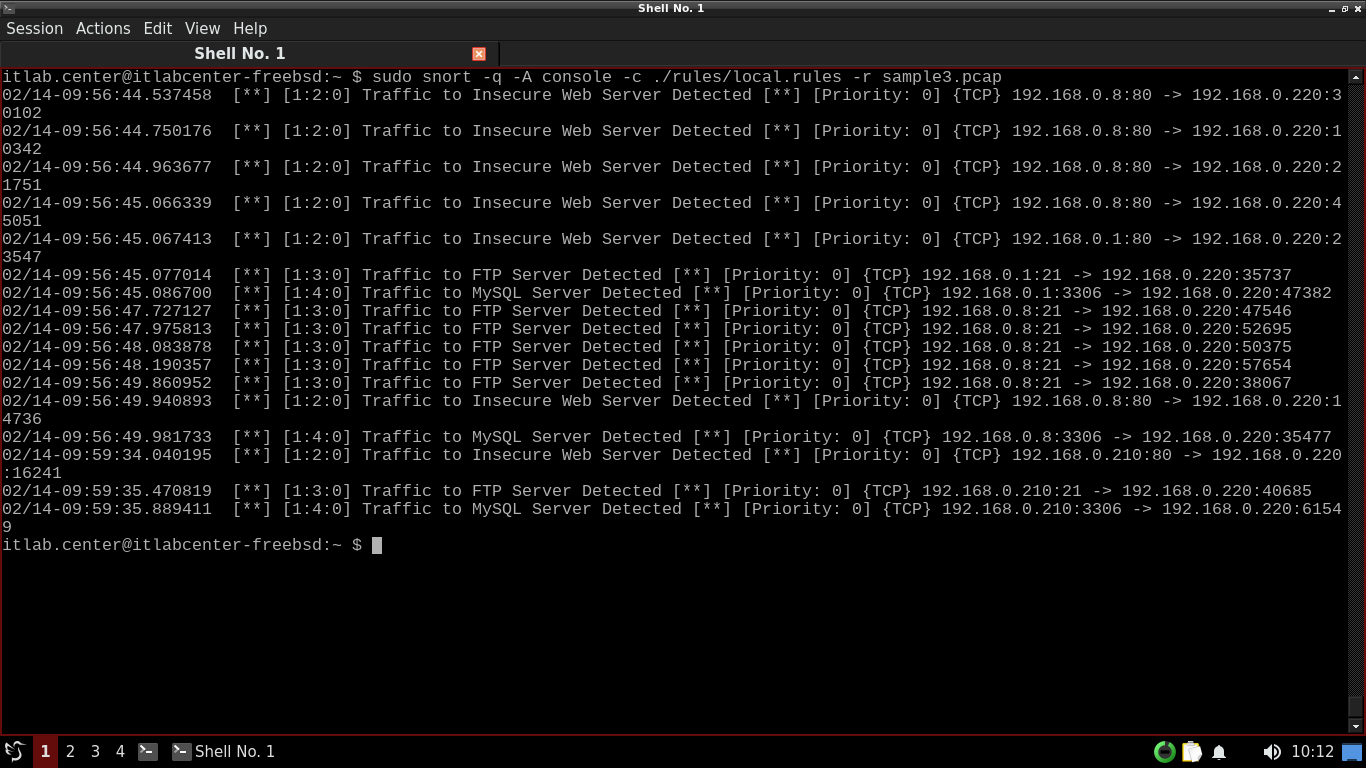
Although we scanned 256 ip addresses, we only see a handful of alerts for each of our premade detection rules
This is because Nmap will only send a connection packet to a port for IPs deemed alive in the host discovery
Congratulations, in this lesson, you learned some basic Snort commands and practiced adding and testing rules
You have gained valuable skills in network security architecture and configuration as well as network scanning