In this lab, explore the foundational concepts of networking through the lens of the OSI model. To bring theory into practice, use Wireshark, a powerful network protocol analyzer, to capture and inspect real-time data. This hands-on exercise allows you to: Visualize how packets traverse different OSI layers, identify protocols like TCP, UDP, HTTP, and DNS in action, and analyze headers and payloads for insight into network behavior
Cybrary is a well established and free IT training platform with several intuitive labs to explore
A paid subscription with more advanced labs is available as well outside the scope of this platform
Head to https://www.cybrary.it to create a free account for learning available on their platform
Head to Network Reference Models to complete this lab for yourself or perform on your homelab below
Quick Links:
Requirements:
• Windows PC w/ Internet Connection
• USB Flash Drive w/ at least 8GB Capacity
• Second PC with at least 2 GB of memory and 2 CPU cores
1. Networking Models Overview
Networking has long been though of as a particularly confusing part of computer science and studies
Because of this models have been developed to provide clarity to the domain which we will explore
These are conceptual models that provide representation of how data is transmitted over a network
Each model consists of a stack of layers which are each dependant on adjacent surrounding layers
These layers have an implied directionality, you either go down the stack or you go up the stack
At the bottom of the stack is electricity, ones and zeros, and at the top lies computer software
Data moving down the stack undergoes encapsulation, where each layer is wrapped in additional info
The additional information typically takes the form of headers or trailers, details added to data
Once fully encapsulated the information is sent down the physical wire until it reaches the target
At that point the data undergoes decapsulation as it is stripped of all of the extra information
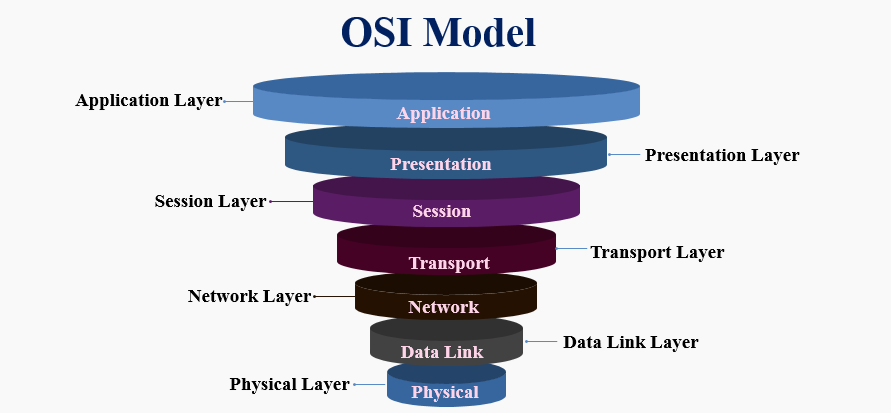
2. The OSI (Open Systems Interconnect) Model
The OSI Model was created by ISO (International Standards Organization) and consists of 7 layers
The bottom 4 layers are known as 'media' layers, and include addressing, data transport and delivery
The top 3 layers are referred to as 'host' layers, and rely on the physical scaffolding of the media
Host Layers:
|
Layer |
OSI Layer |
Protocol Data Units (PDUs) |
Device Examples |
Protocol Examples |
7 |
Application |
Data |
L7 Firewall |
HTTP/S, SSH, SMTP, FTP |
|
6 |
Presentation |
Data |
L7 Firewall |
All the above |
|
5 |
Session |
Data |
L7 Firewall |
All the above |
Media Layers:
|
Layer |
OSI Layer |
Protocol Data Units (PDUs) |
Device Examples |
Protocol Examples |
|
4 |
Transport |
Segments(TCP)/Datagrams(UDP) |
L4 Firewall |
TCP (Reliable Transmission) UDP (Unreliable Transmission) |
|
3 |
Network |
Packets |
Router |
IP, ARP |
|
2 |
Data Link |
Frames |
Switch |
ARP, Wi-Fi |
|
1 |
Physical |
Bits Symbols |
All the above |
Ethernet, Wi-Fi |
Here is a more detailed breakdown of each of the 7 layers within the OSI model:
• Layer 7 (Application) - The human-computer interaction layer
This layer handled the services and programs that use the network to transmit and receive data
This includes software like web browser, email clients, online video games, and streaming apps
• Layer 6 (Presentation) - Formatting and presentation of data
This layer handles the compression/decompression, encryption/decryption and encoding/decoding
These processes change data between a form which is human presentable and a form for systems
• Layer 5 (Session) - Managing communication sessions between devices
This layer is responsible for organization, setting up, maintaining and tearing down sessions
Along side this, layer 5 also performs processes like authentication and authorization of users
This ensures that sessions are open long enough to transfer data and closed once no longer needed
• Layer 4 (Transport) - Transporting data between hosts
This layer is what handles the systems ports which are used for different networking functions
The protocols used at this layer are Transmission Control Protocol and User Datagram Protocol
TCP sends segments of data which contain delivery guaranteeing mechanisms to ensure reliability
UDP on the other hand sends datagrams which will attempt delivery but do not carry guarantees
• Layer 3 (Network) - Transmitting data between devices in different networks
This layer allows communication between different networks by routing packets with IP Addressing
The process uses physical devices called routers which act as the network border and entrance
• Layer 2 (DataLink) - Transmitting data between nodes on a local network
This layer transmits packets locally by broadcasting them across the network to other systems
The process uses physical devices called switches and hubs which act as nodes and route packets
Unlike in the Network Layer, the DataLink layer uses MAC addresses rather than IP addresses
• Layer 1 (Physical) - Transmitting data over a physical medium
This layer uses electrical signals, the building blocks of communication between electronics
The process can utilize physical cabling or can also be done using radio waves over the air
3. The TCP / IP Model
This model simplifies the stack by combining several of the previous layers you're familiar with
In contrast to the theoretical OSI model, the TCP/IP model is more practical to modern networks
The TCP/IP model was implemented as the Internet Protocol Suite as the backbone of the internet
The model combines OSI layers 1-2 into a single layer 1 and OSI layers 5-7 into a single layer 4:
• Layer 1: Network Access
• Layer 2: Internet
• Layer 3: Transport
• Layer 4: Application
The Internet and Transport layers were not collapsed since the are fundamental networking concepts
Since we have already reviewed the more detailed OSI model, the TCP/IP is very easy to understand:
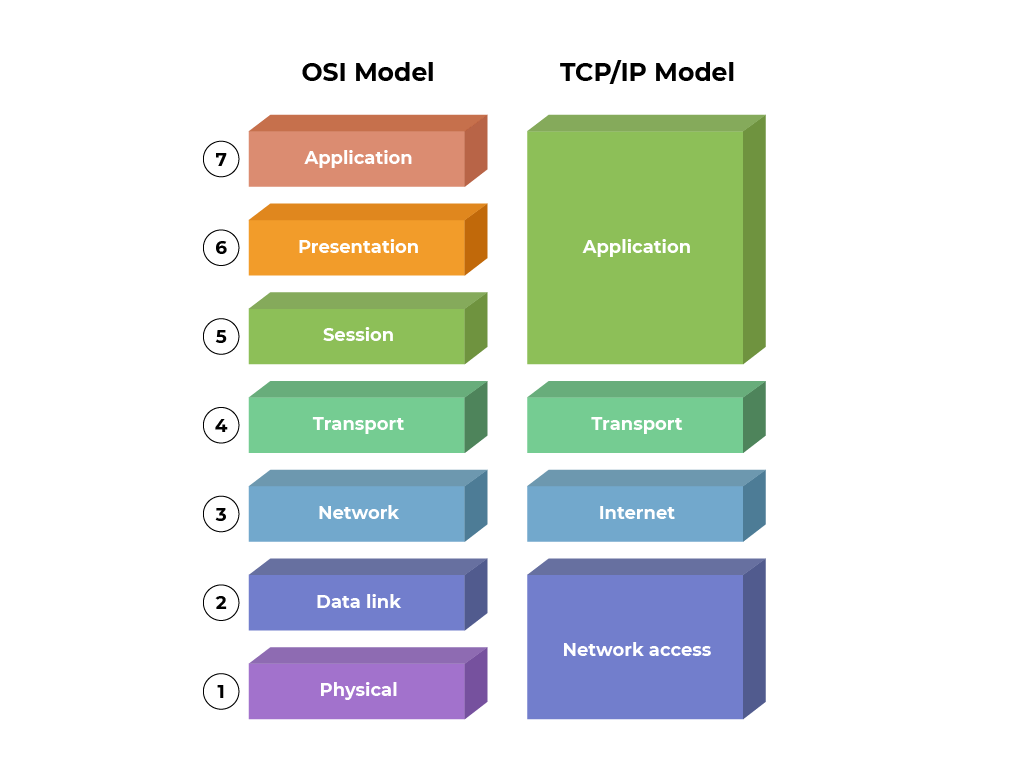
It is important to note that these models are not in contrast to one another, both are useful
The layers are important to understand, but more important is the relationship between layers
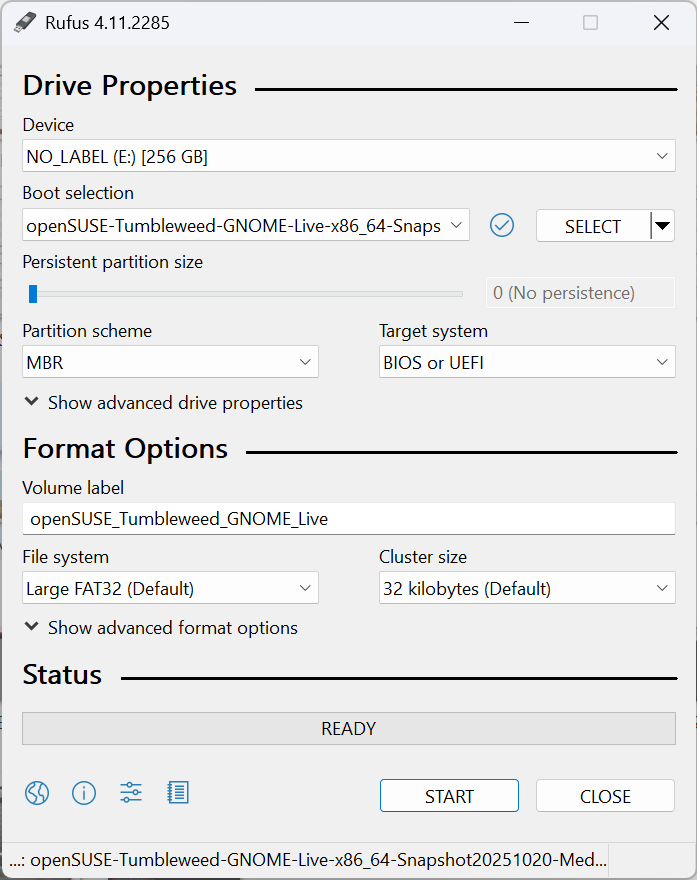
4. Create OpenSUSE Live USB
Now let's ditch the theory and move into something more hands on to set up a future packet capture
OpenSUSE is an Open Source variant of the SUSE Linux Enterprise distribution maintained by SUSE S.A.
You can use the operating system without having to install it onto your hard driver with a live usb
Download OpenSUSE x86_64 Live ISO: OpenSUSE Tumbleweed Alternate Images
Download Rufus Disk Imager: Rufus Official Download
Insert USB Flash Drive, run rufus.exe, select target drive, select CentOS x86_64 Live Iso, start:
Remove USB Flash Drive and Insert into unused PC. Start PC and press hot boot key on startup:
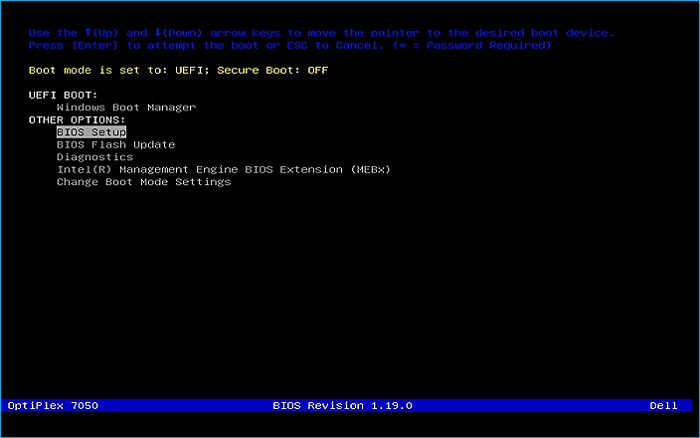
Select UEFI USB Flash Boot. Allow CentOS to load and scroll to select the Start OpenSUSE Live:

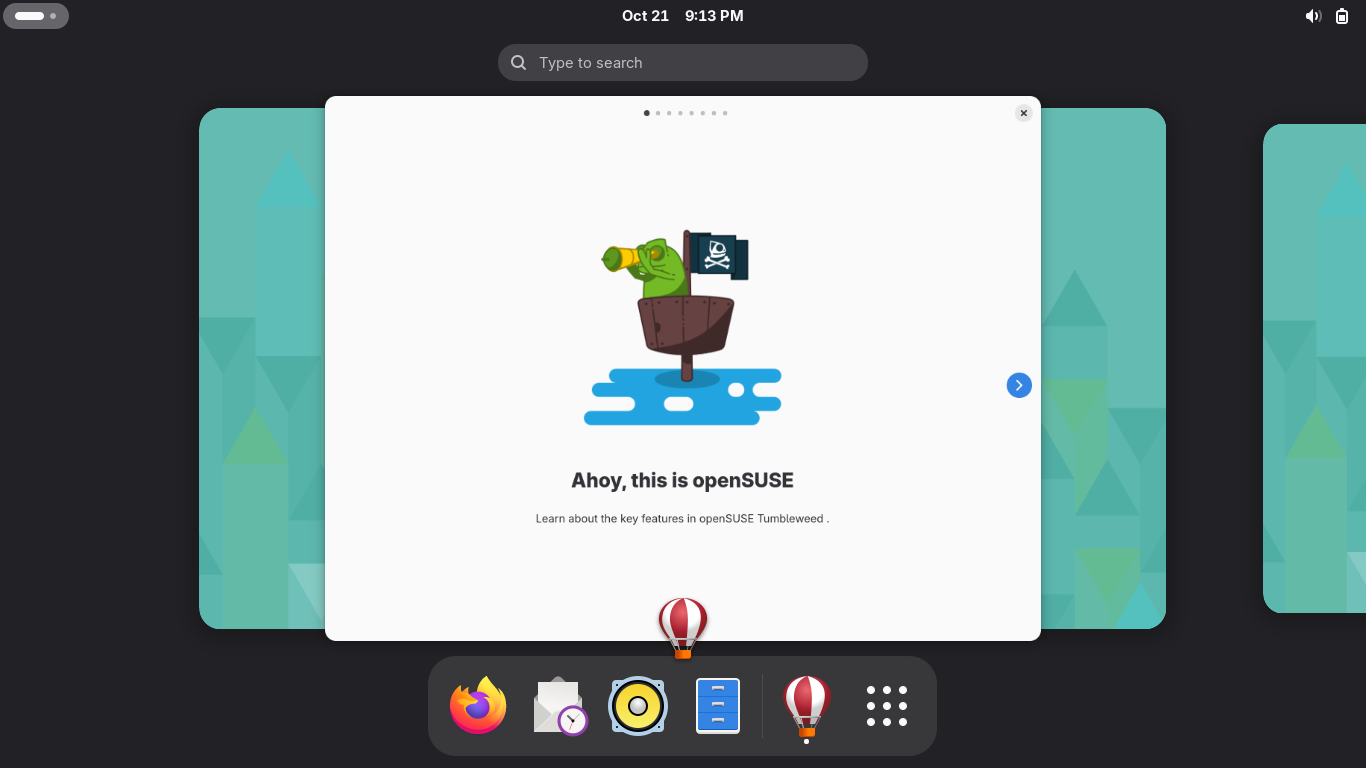
Now allow your workstation a moment to load and you will be taken to the OpenSUSE Desktop Utility:
5. Perform A Packet Capture
OpenSUSE structures the desktop environment into seperated containers for isolation of precesses
You can close the OpenSUSE welcome message and click on the nine white dots to open the applications:
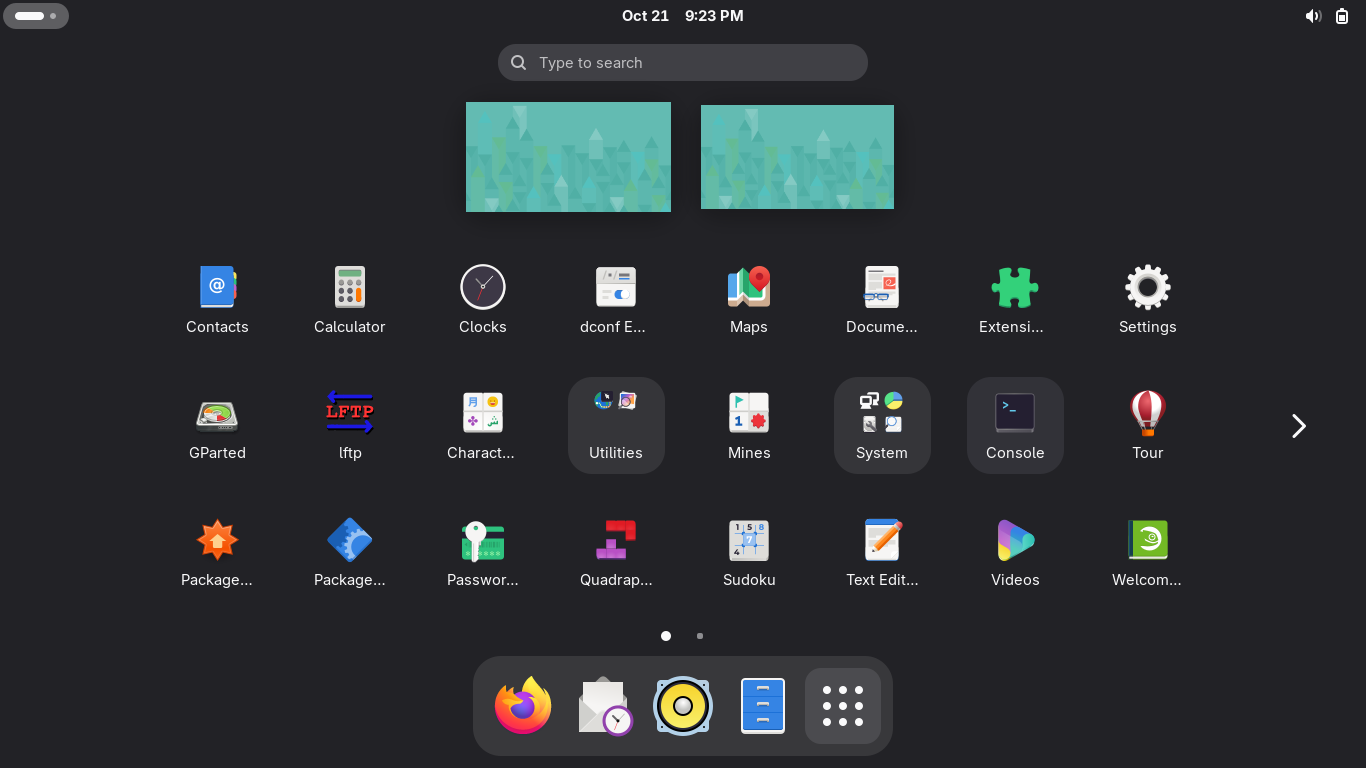
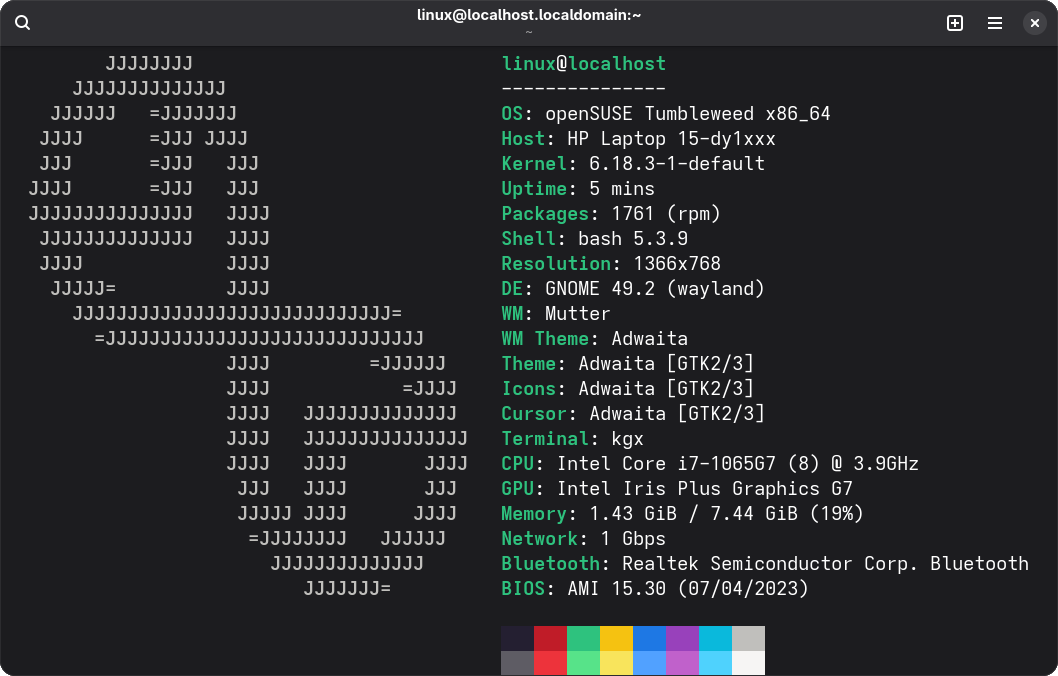
Here we can see all of the applications which come pre-installed with our image, select the Console:
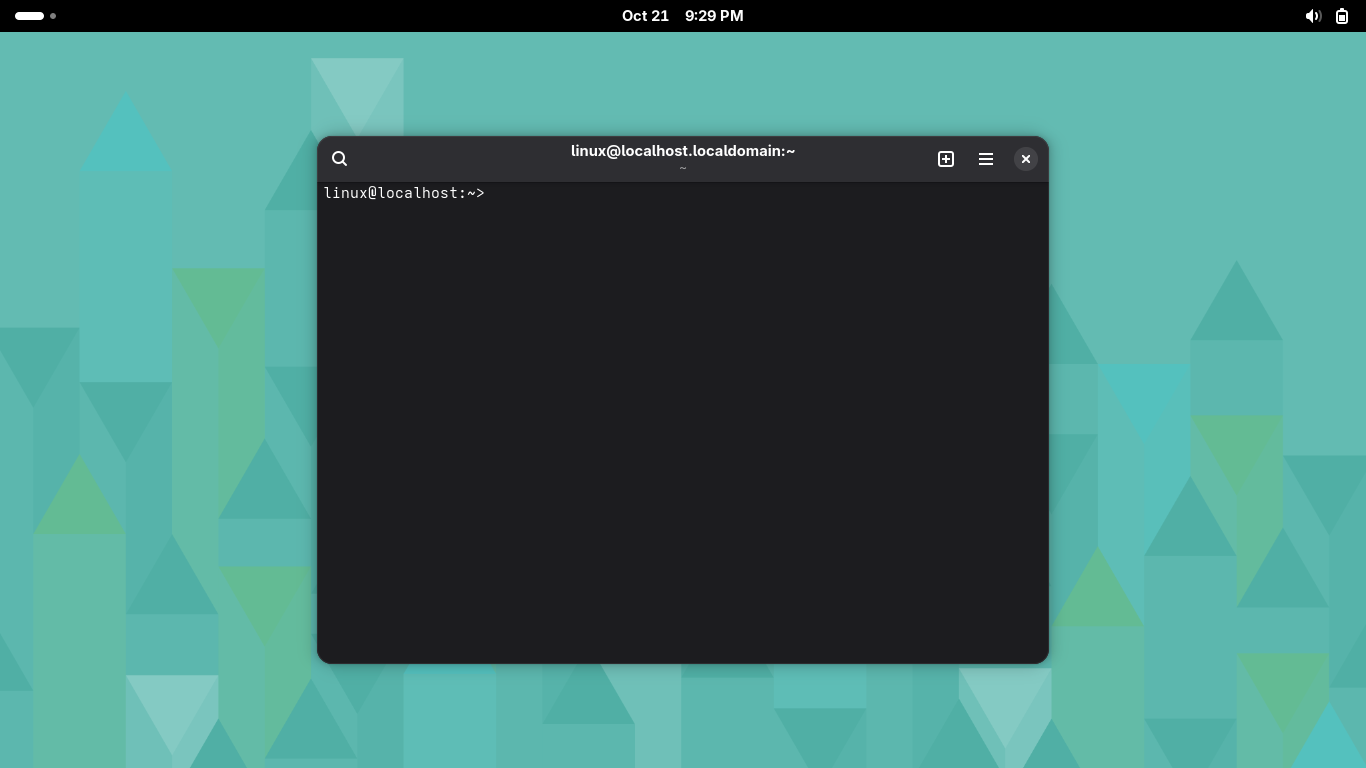
The Console application is the OpenSUSE equivalent of a terminal window and will serve and our CLI
Wireshark is a free, open-source packet capture and analysis tool we will use to perform captures
Run the following command from the OpenSUSE Console to update the base live systems packages:
linux@localhost:~> sudo zypper update -y
OpenSUSE uses the YaST package manager and the zypper command to install software from repositories
Run the following command from the OpenSUSE Console to install the wireshark dependencies and GUI:
linux@localhost:~> sudo zypper in wireshark
Head back to the applications menu and type in Wireshark at the top, select the Wireshark - su...:

You can drag the Wireshark program window to the top of the screen to get a fullscreen view:
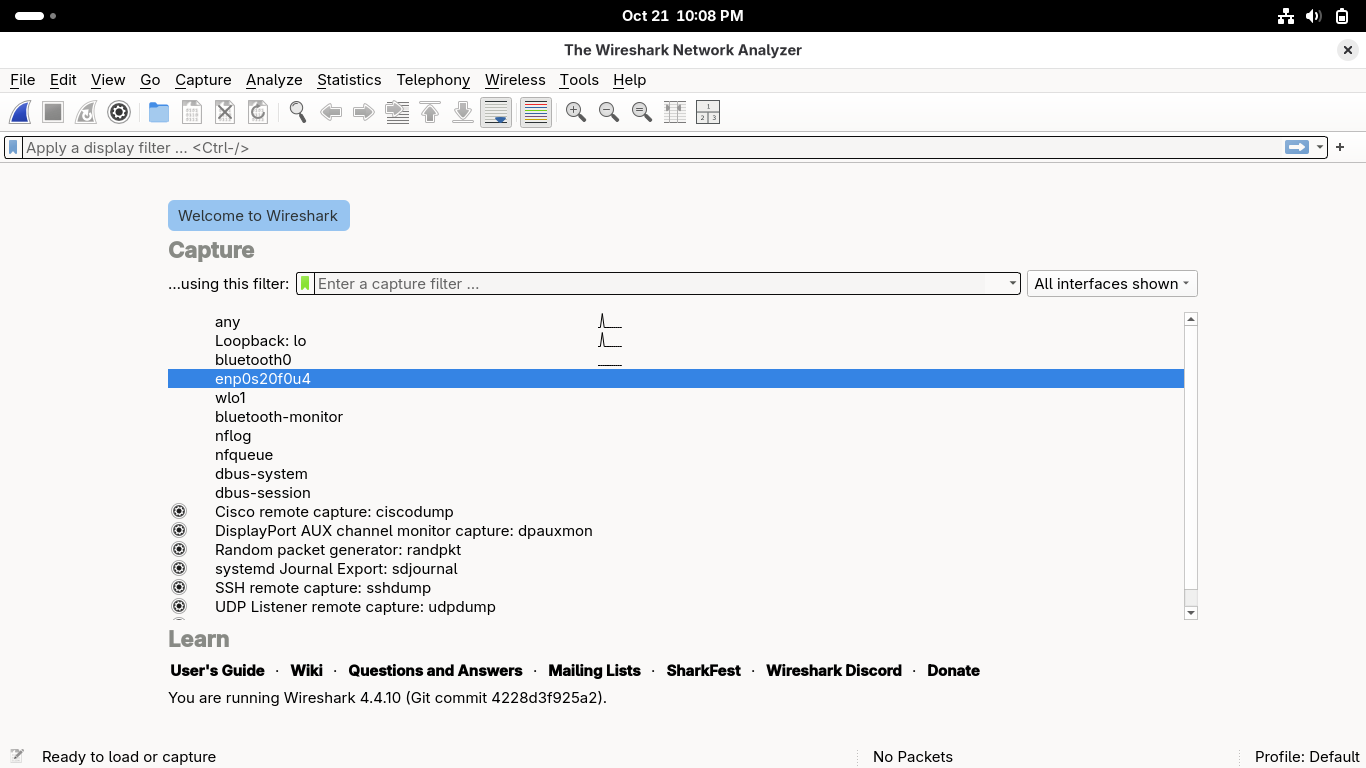
If you are on Wi-Fi then select the wnp interface, if you are on wired then select the enp interface
Click the blue shark fin icon at the top left to begin capturing network packets in wireshark:
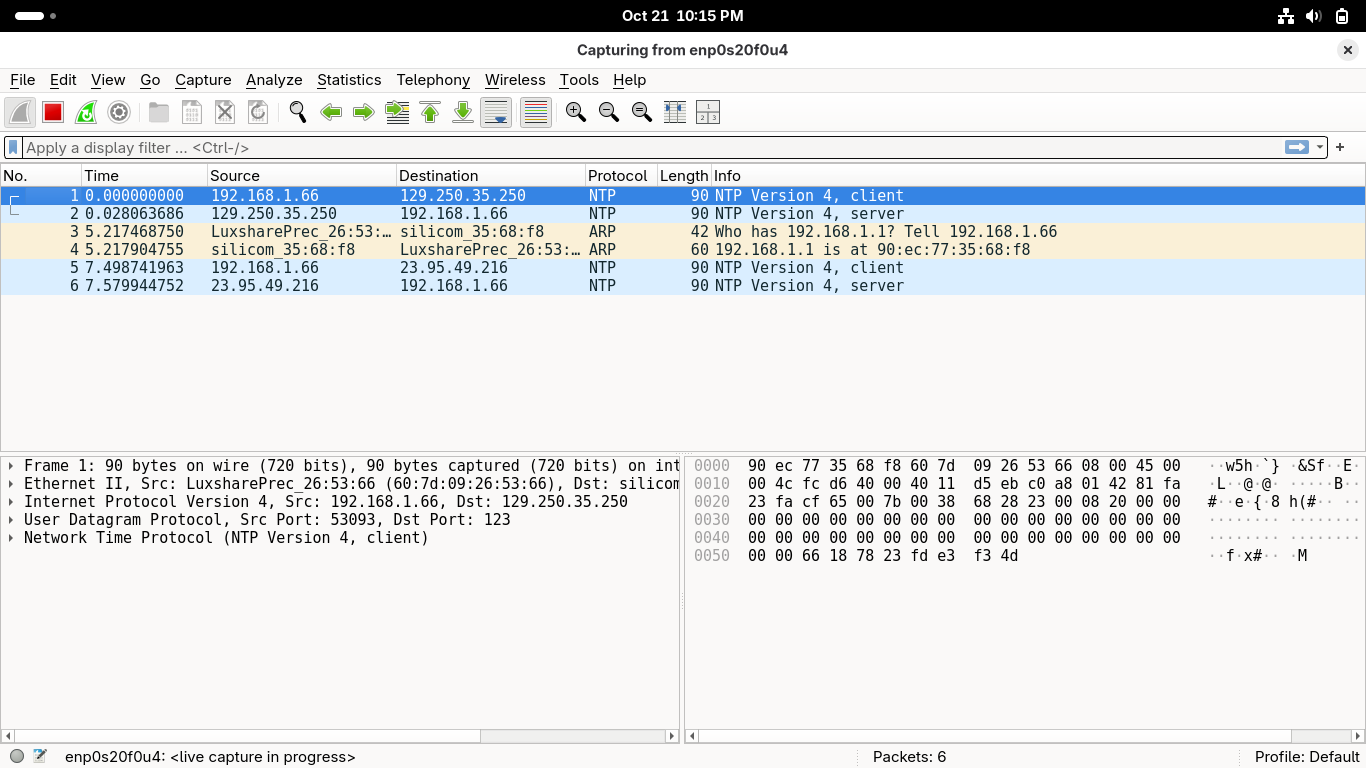
Some basic background traffic and messages may be displayed but I think we can make something better
Now click the bar at the top left of the desktop and select the console windows he used previously
Run the following command from the OpenSUSE Console to generate some interesting network traffic:
linux@localhost:~> ping 8.8.8.8 -c 10
Click the bar in the top right and then the firefox web browser icon which will appear at the bottom
Using the firefox browser head to any website like google.com or itlab.center, close firefox after
Return to the wireshark window and click on the red square at the top left to stop the capture:
In Wireshark head to File > Save As to save this capture session as Capture1, click save of course:

Next section we will simulate opening a capture file at a later date, go ahead and close Wireshark
6. Captured Packet Analysis
Now we will open and analyze our packet capture file as if we were another analyst at a later date
Head back to the applications menu and type in Wireshark at the top, select the Wireshark - su...:
You can drag the Wireshark program window to the top of the screen to get a fullscreen view:
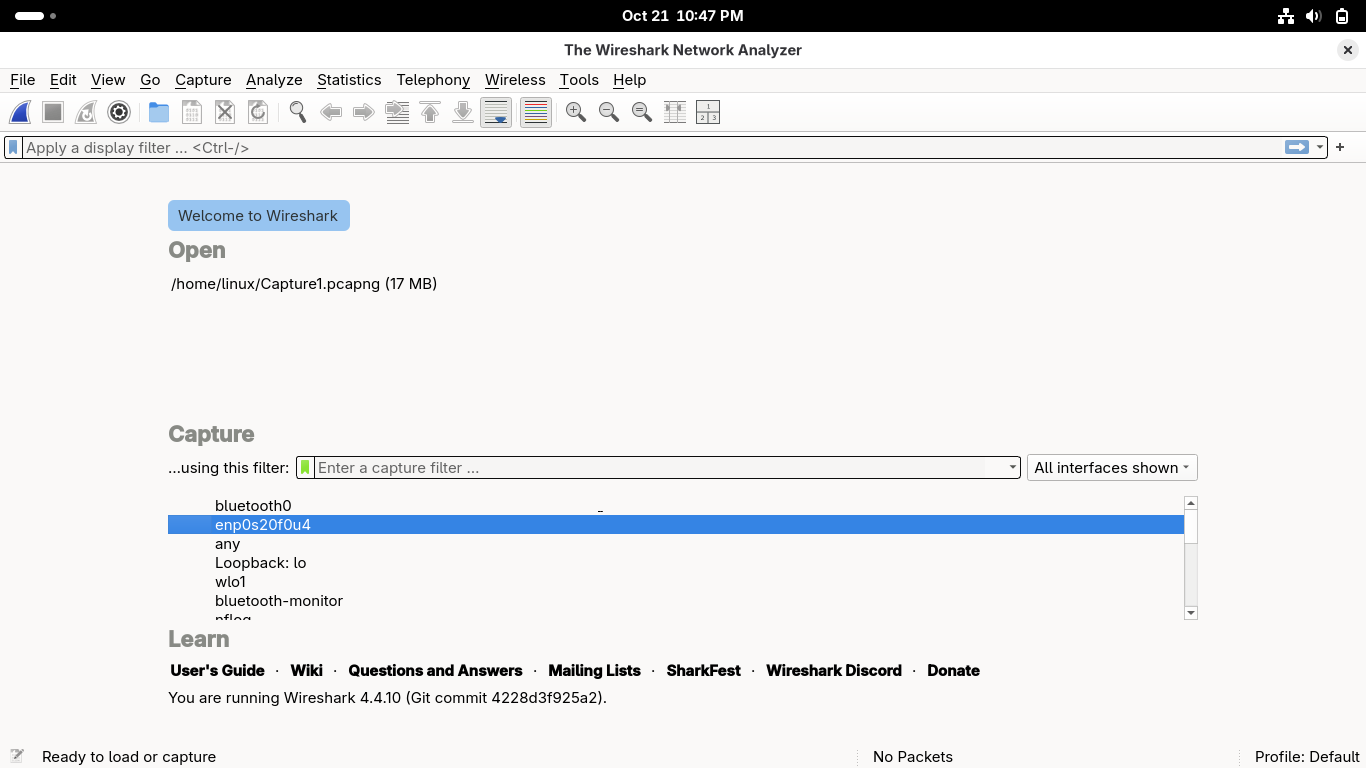
Notice the 'Open' option in wireshark this time, go ahead click on our previously created capture:
In this guided exercise, you will examine the TCP/IP and OSI model layers through the Wireshark tool
Wireshark will display all the encapsulated portions of a packet in its packet details view pane
However it does not conform to either TCP/IP or OSI model, but rather a combination of both of them
It ios important to note that Wireshark will list lower layers at the top and the higher layers below
The Packet List pane (top) and the Packet Details pane (middle) are the ones you're interested in
You'll select packets from the Packet List, and inspect its encapsulated layers in the details pane
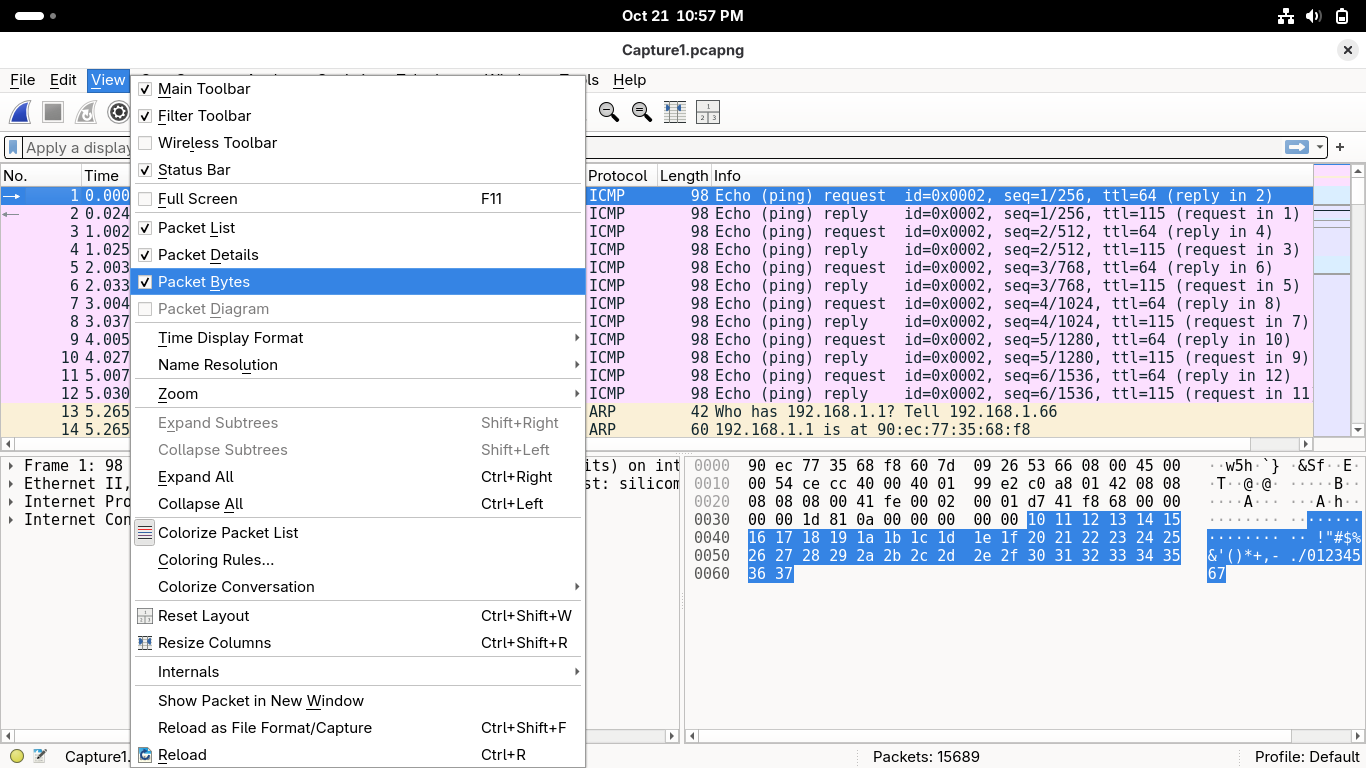
Before we begin, go ahead and remove the Packet Bytes pane from your view from View > Packet Bytes:
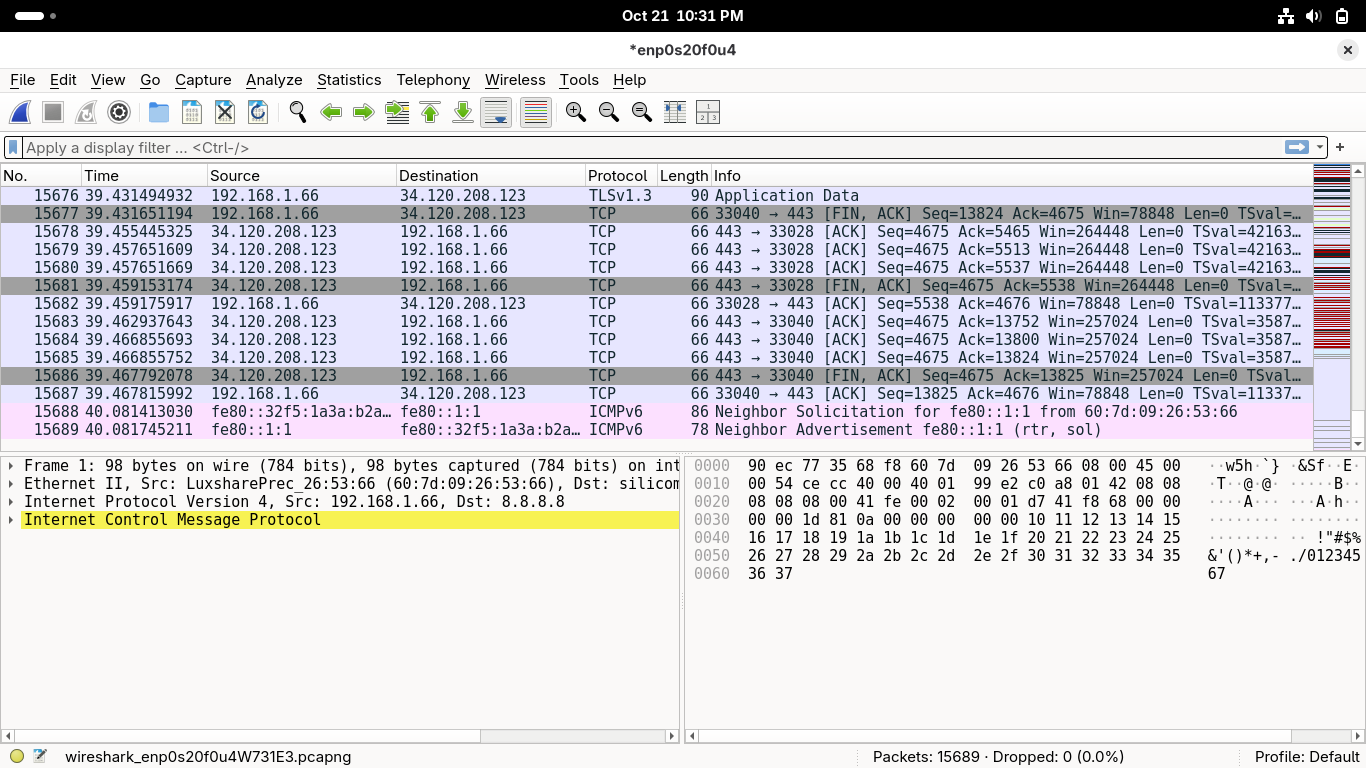
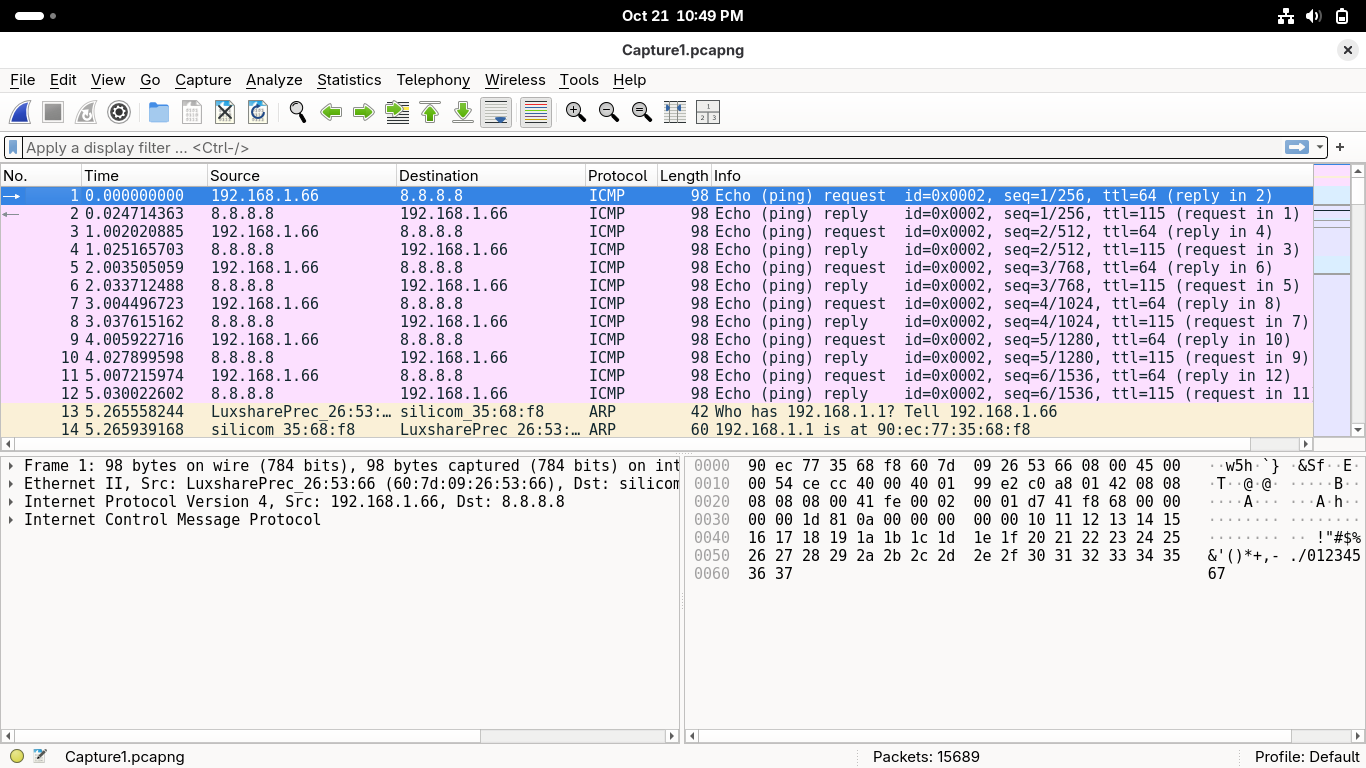
From the Packet List view, select the first ICMP packet with destination listed a 8.8.8.8 (Google DNS)
This packet is the result of our ping command which uses the ICMP (Internet Control Message Protocol)
Let's first examine the physical layer, double click on the line which contains 'XX bytes on wire":
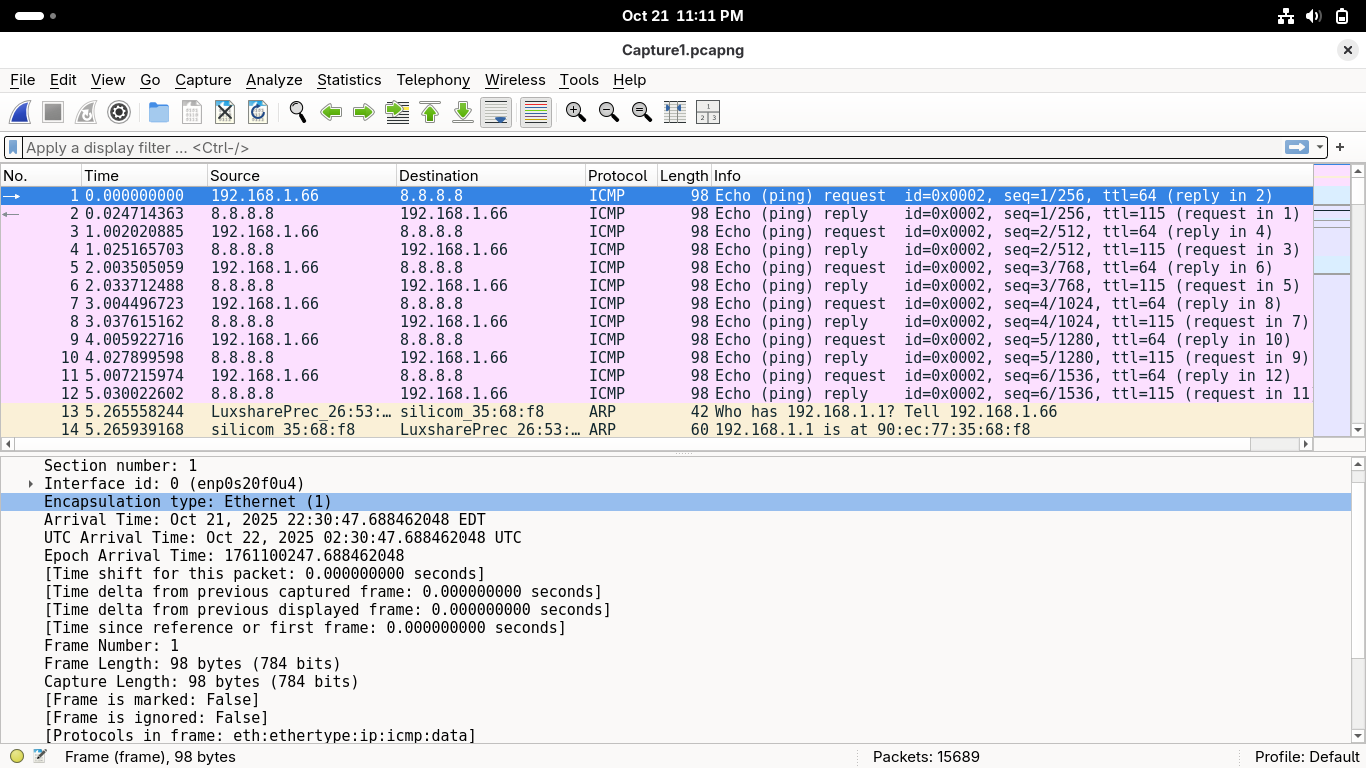
This frame layer is included in every packet and displays information about how data is transmitted:
• Encapsulation Type
This refers to the top physical layer present in the packet which described the type of transmission
We can see in our example that Ethernet or cabled connection is displayed but you may find 802.11
IEEE 802.11 is the protocol standard for wireless or Wi-Fi based connection types and is common to see
• Protocols In Frame
Contains a colon-separated list of all of the transport layer protocols contained within this packet
There are many types of transport layer protocols, thousands in fact, in this example we are using ICMP
These are displayed left-to-right from the lowest to highest protocol layer found within the packet
Double click on the Frame row to collapse it, then double-click on the Ethernet II row to expand it:
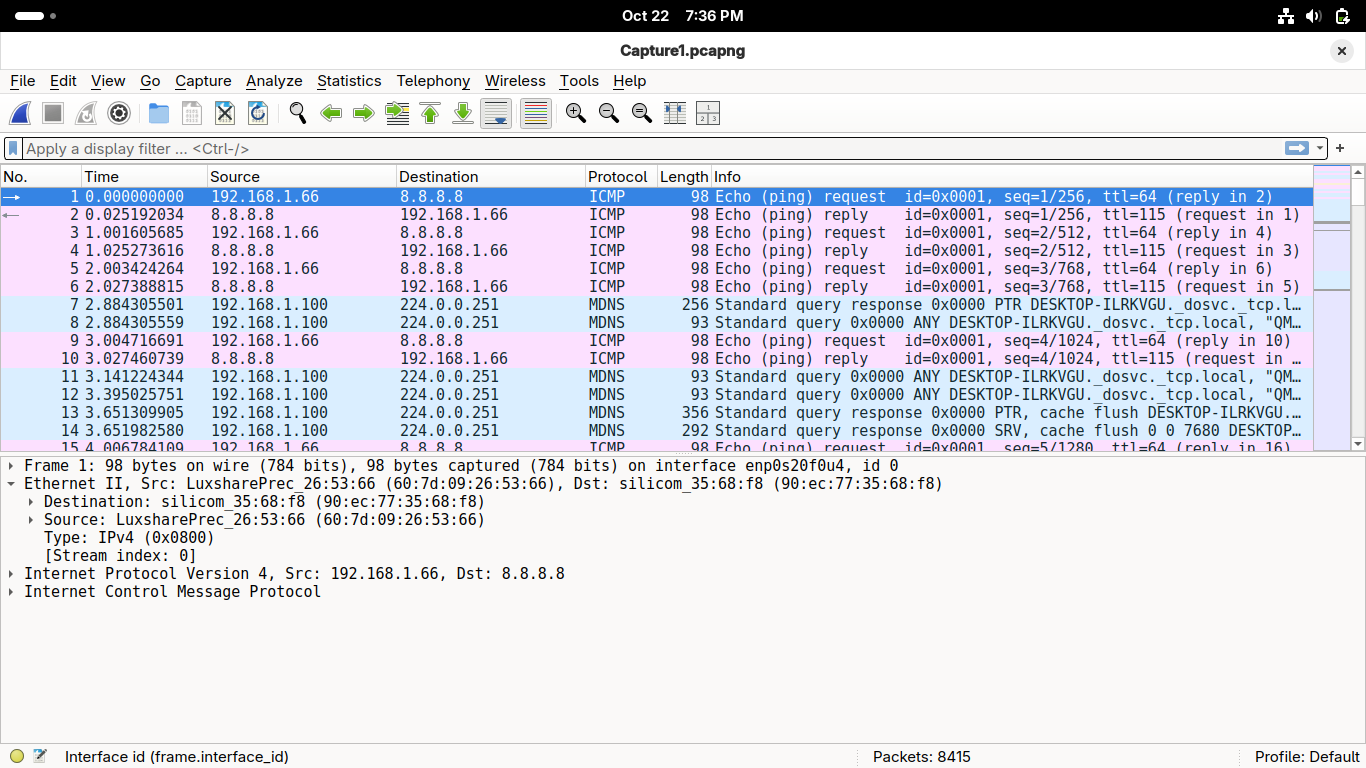
This contains the Physical Layer information, such as the data rate and frequency band if on wireless
On an ethernet based connection this will also show information on the DataLink layer of networking
You can tell based on the presence of MAC addresses which are used for local level routing of packets
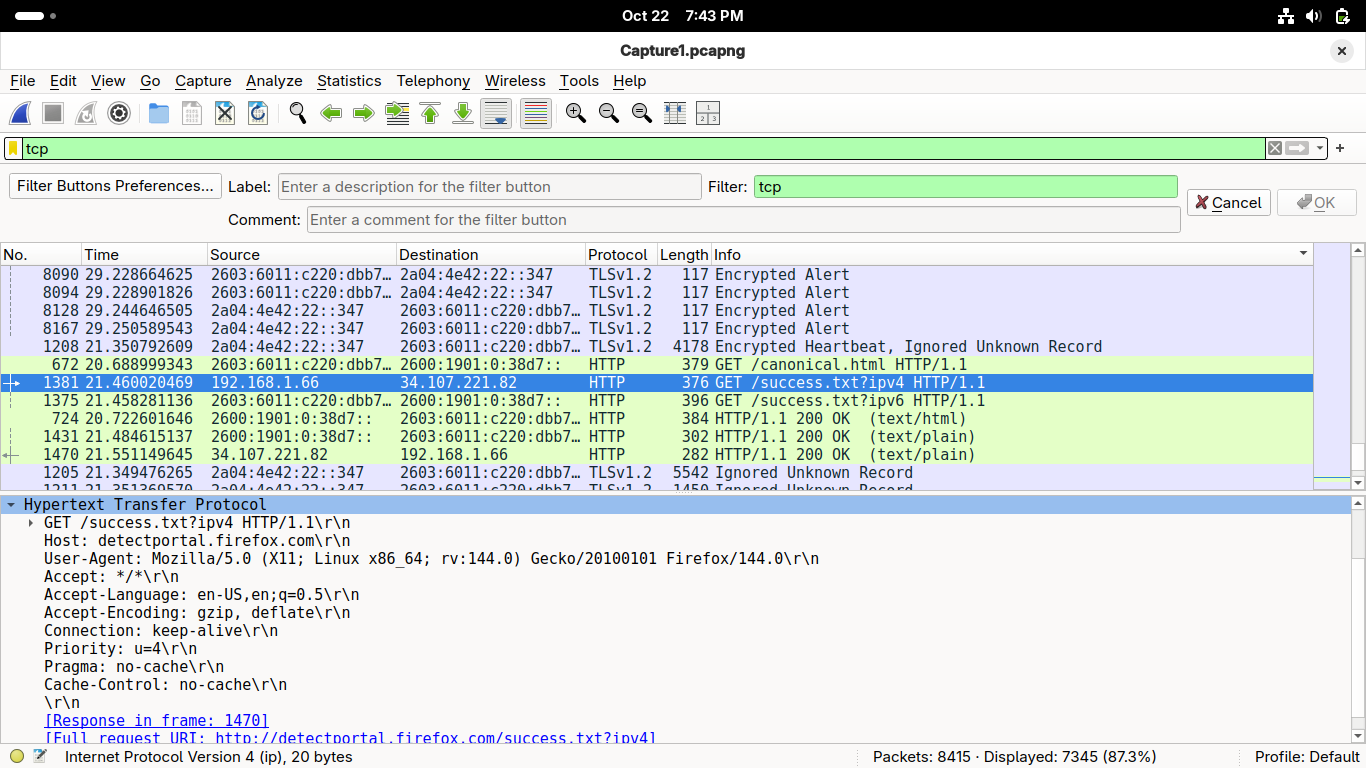
Now let's switch to our Web Traffic we generated with Firefox, type 'tcp' in the display filter text bar:
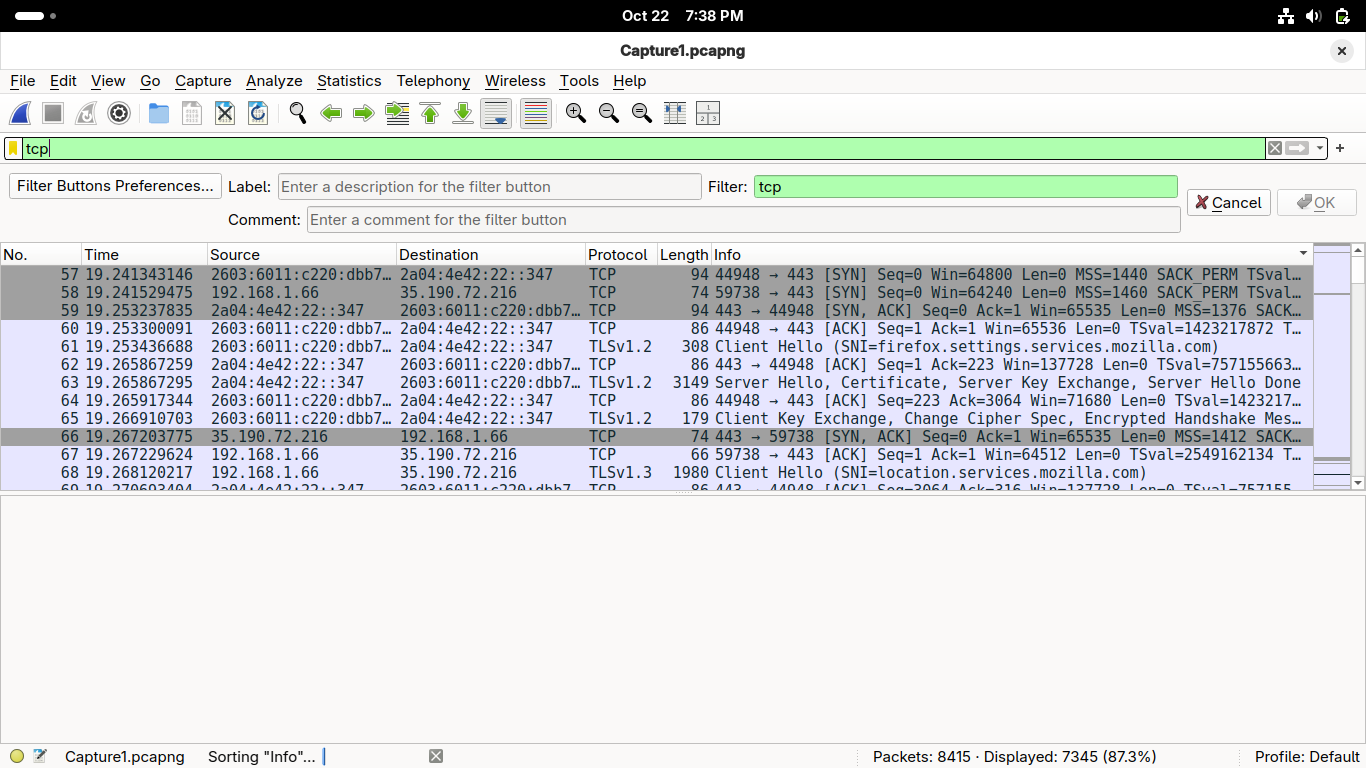
Wireshark is now displaying only packets which use the Transmission Control Protocol like web traffic
Notice you can see both TCP and HTTP packets in the list, this is because each container TCP information
HTTP packets contain higher-level Application Layer details and are encapsulated by the layers below it
This includes the transport layer TCP information, click on the first displayed HTTP packet in Wireshark:
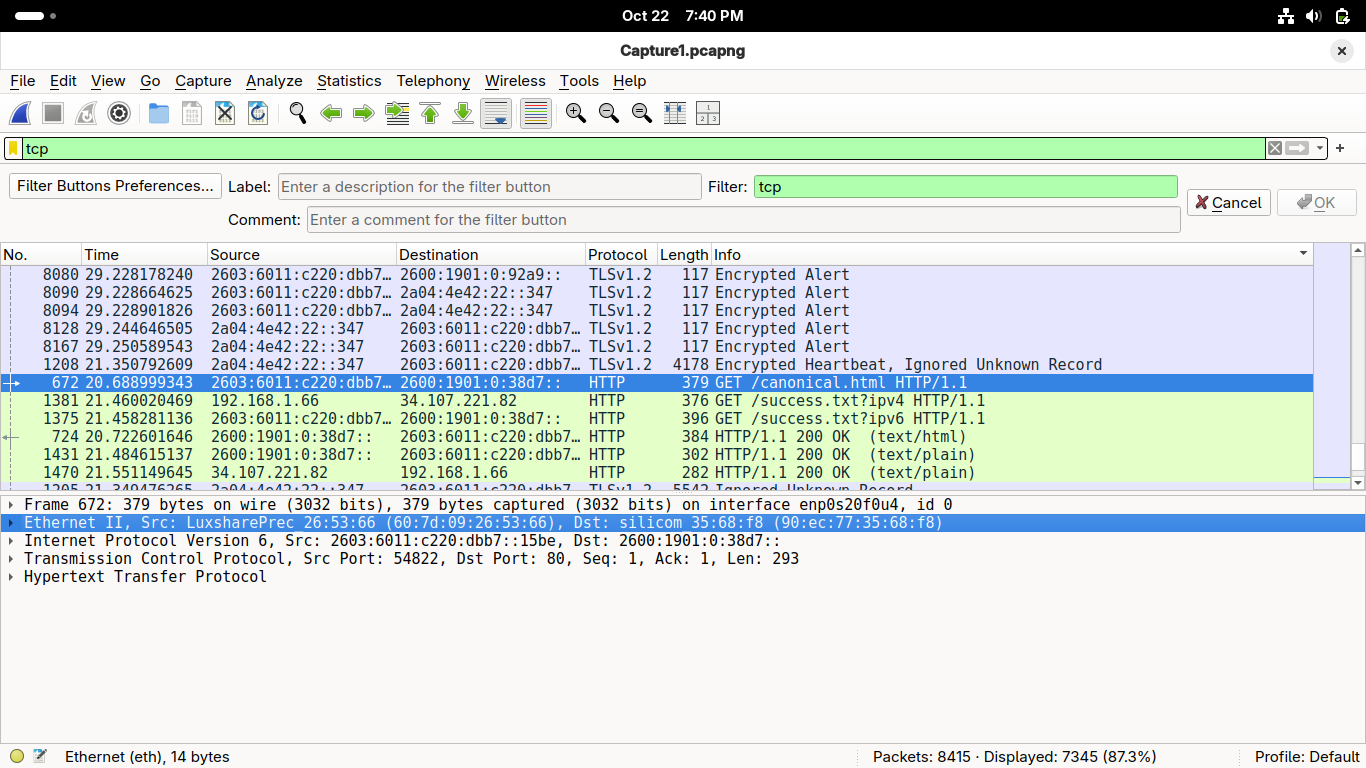
You can see the same media layers present in the ICMP packet with additional higher-layer information:
• Physical Layer (Ethernet/Radio Information)
• Data Link Layer (Ethernet/IEEE 802.11 Information)
• Internet/Network Layer (Internet Protocol Version 4)
• Transport Layer (Transmission Control Protocol, aka TCP)
• Application Layer (Hypertext Transfer Protocol)
Double-click on the Internet Protocol Version 4 row within the Wireshark Application to expand it:
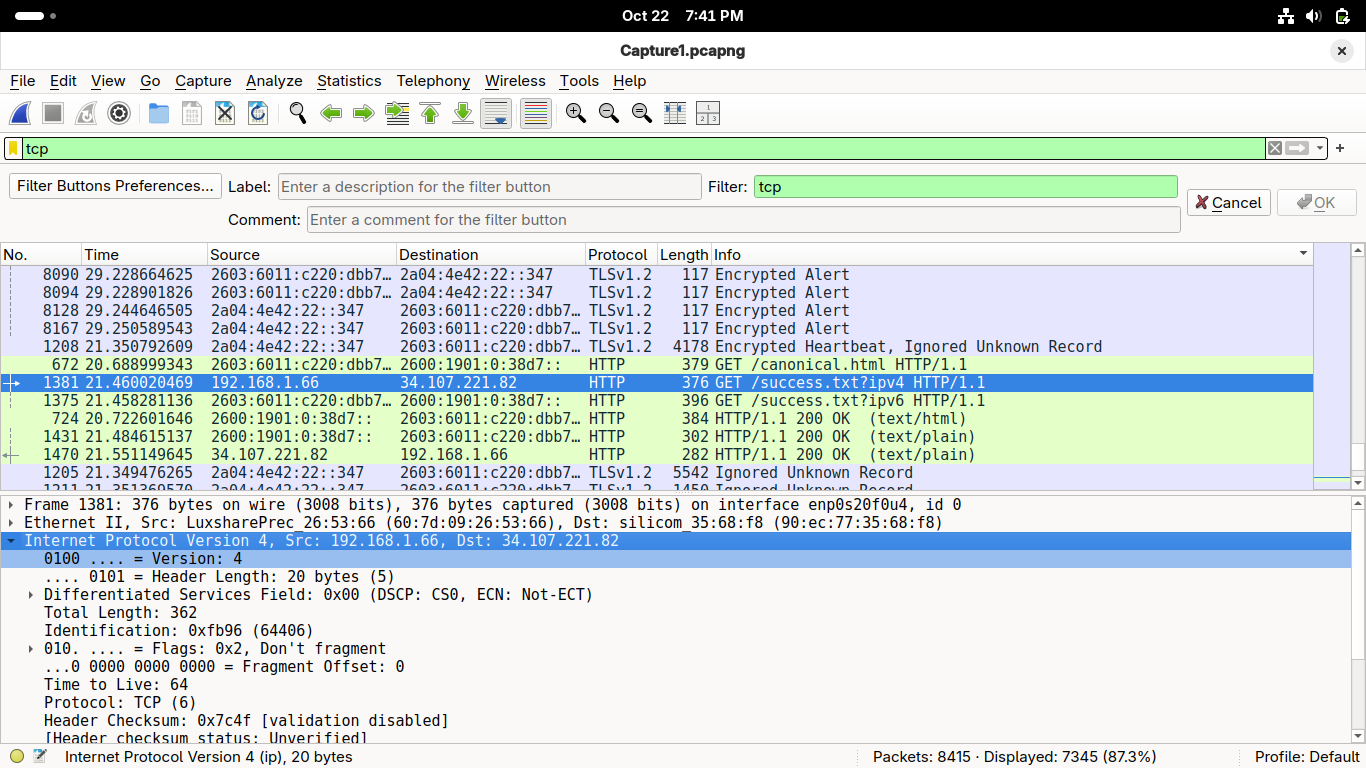
You can find many interesting Network/Internet layer pieces of information located here:
• Source and Destination IP addresses
• Protocol
Now let's continue moving up the stack and check out that encapsulated Transport Layer protocol
Double-click on the Internet Protocol Version 4 to collapse it within the Wireshark Application
Double-click on the Transmission Control Protocol row to expand it in the Wireshark Application:
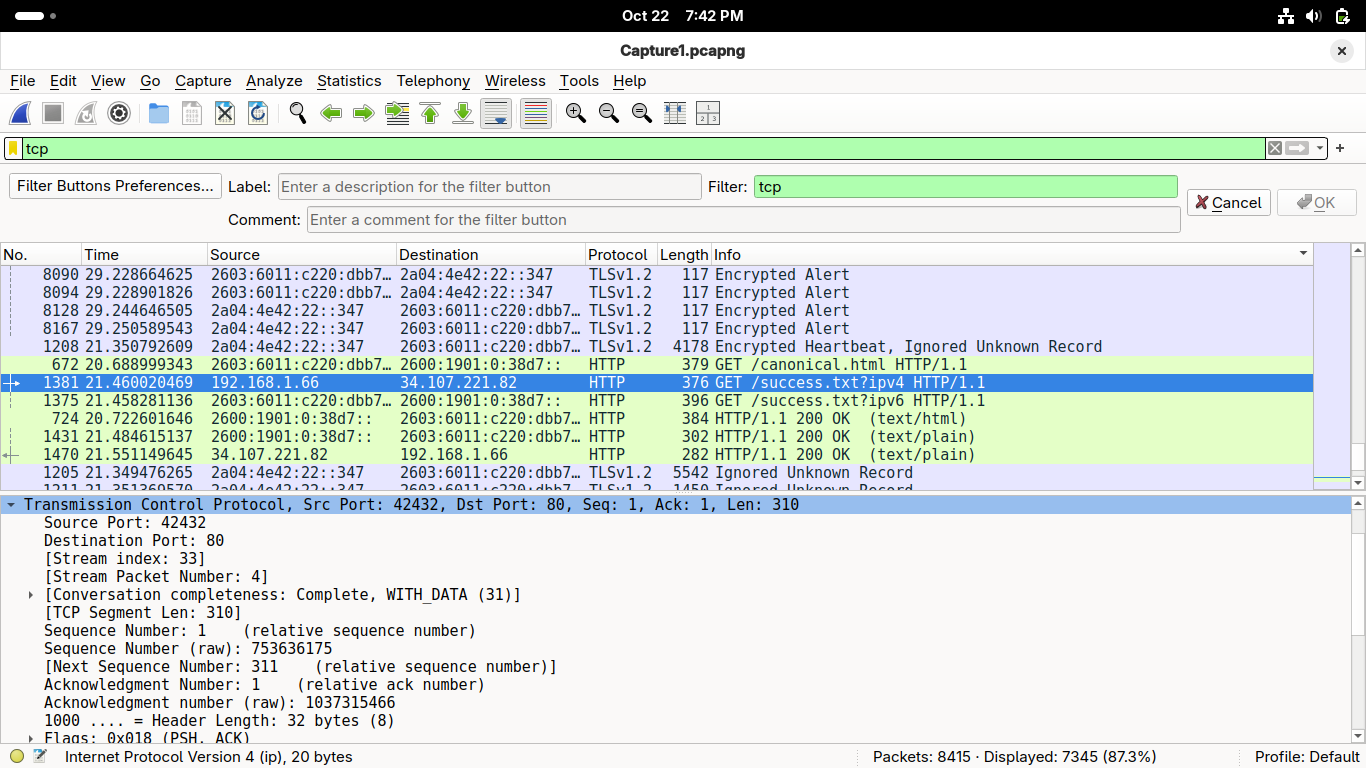
This layer is the province of ports, you can see both the destination port and the source port
You also see sequence and acknowledgement numbers, which help TCP with it's delivery guarantee
Double-click on the Transmission Control Protocol to collapse it within the Wireshark Application
Double-click on the Hypertext Transfer Protocol row within the Wireshark Application to expand it:
You've reach the top layer of abstraction where you'll find the HTTP Requests the browser made
You can also find here the full hostname URI address in the form of protocol://ip-address:port
Almost done, but this is just the HTTP request, select the second HTTP packet for the response:
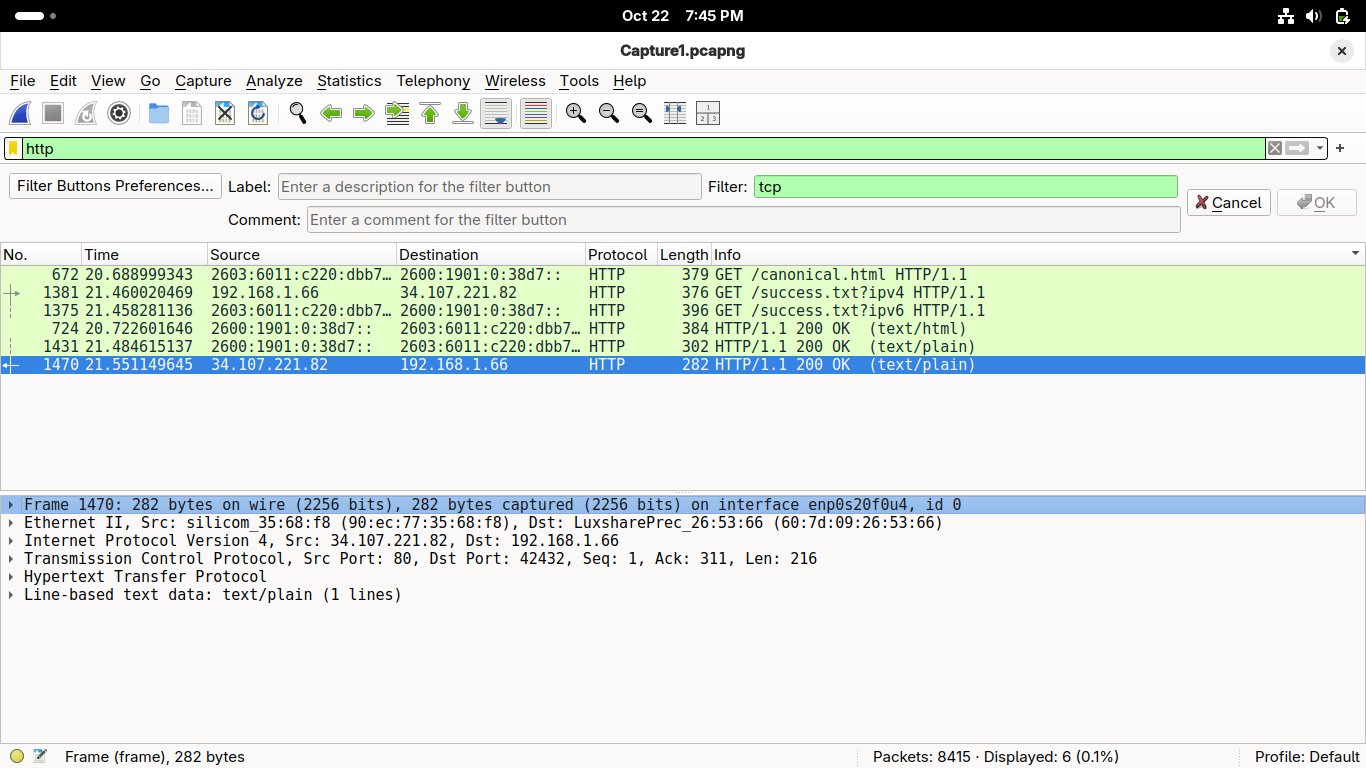
There are two new details here: and additional Transport layer row and a new Application layer
The additional Transport layer row notes the TCP segments that were reassembled at the delivery
The new Application layer contains the information sent back to the client from the server system
In the Packet Details pane, double-click the Line-based text data row to expand it in Wireshark:
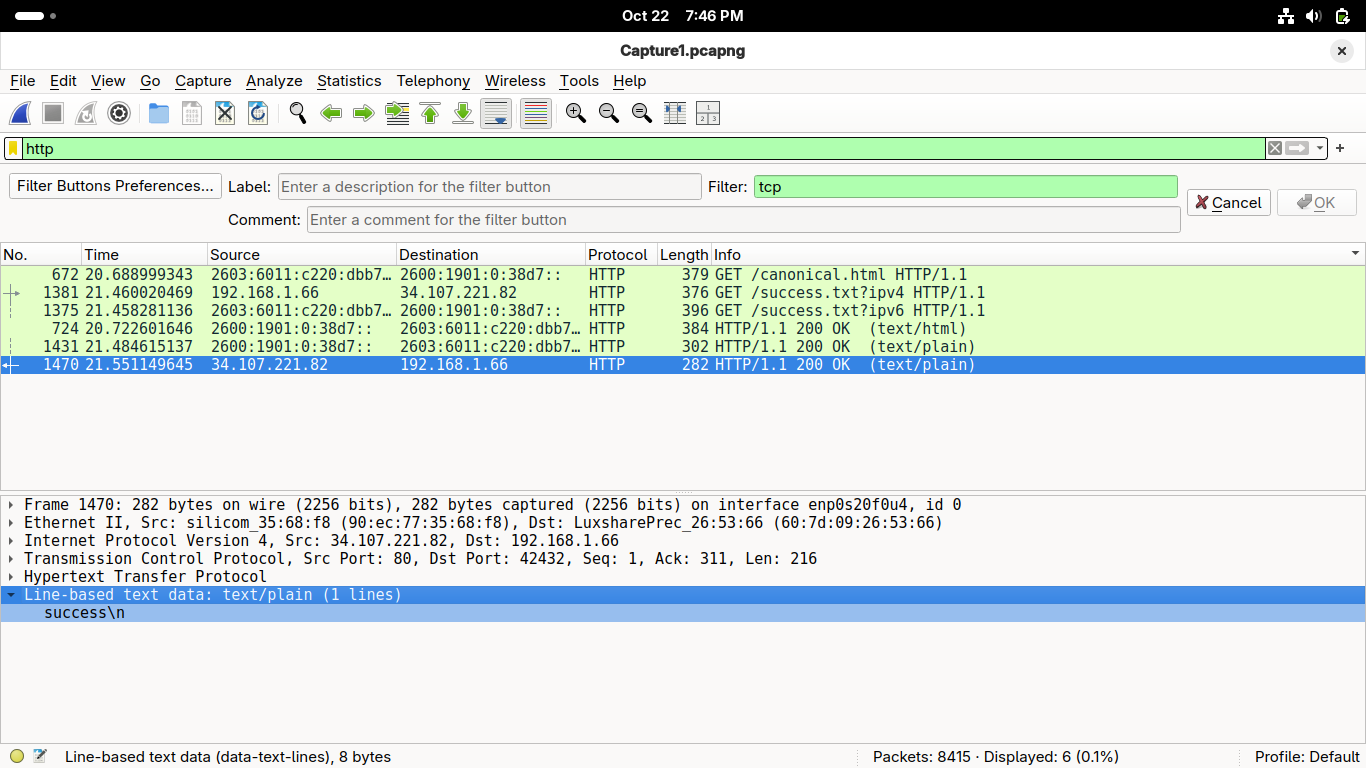
Here is the human-generated message that was sent down the stack for lower-layer encapsulation
Once sent over the air, the information was sent back up the stack for upper-layer decapsulation
Congratulations of gaining a foundational understanding of frameworks, this will greatly assist
When tackling new networking concepts in the future, be sure to consider how they relate to this