The Wireshark Basics lab introduces the fundamentals of packet analysis and network inspection using Wireshark, one of the most powerful tools in cybersecurity and IT networking. In this guided exercise, learn how to capture, filter, and analyze network traffic across multiple protocols, gaining hands-on experience with the practical applications of packet inspection.
Cybrary is a well established and free IT training platform with several intuitive labs to explore
A paid subscription with more advanced labs is available as well outside the scope of this platform
Head to https://www.cybrary.it to create a free account for learning available on their platform
Head to Wireshark Basics to complete this lab for yourself or perform it on your homelab below
Quick Links:
Requirements:
• Windows PC w/ Internet Connection
• 2 USB Flash Drives w/ at least 64GB Capacity
• Unused PC w/ at least 4GB of Memory
1. Wireshark Overview
Wireshark is a network inspection tool, commonly referred to as a traffic, protocol, or packet analyzer
Packet Analysis refers to the process of intercepting network data packets and examining them to extract
information about their contents, the parties involved in the exchange or the network environment itself

To draw a simple comparison, Wireshark is like an X-ray machine for computer networks - a powerful one
Much like how a doctor uses an X-ray machine to see inside a patient's body, Wireshark provides insight
into a computer network and the packets streaming across it to understand what's happening at each layer
Protocols are just networking languages. Where programs have programming languages for describing their
function and behavior, network communications are made possible by networking languages called protocols
Protocols such as HTTPS or IPv4 are responsible for dictating how systems communicate with one another
All computer systems must agree on a specific way of communicating before they can begin to share data
If data packets are the words of networking, then protocols are the grammar, the syntax, and the diction
In practice, Wireshark can be used for a variety of different purposes. To name a few, Wireshark allows:
• Network Engineers to troubleshoot network performance problems
• Security Analysts to review intrusion attempts and validate internal controls
• Forensic Analysts to gain insights into security breaches and malware distributions
• Penetration Testers to search for sensitive information to give them a foothold on a network
Let's begin to explore this powerful tool by starting with what you will see visually when utilizing it
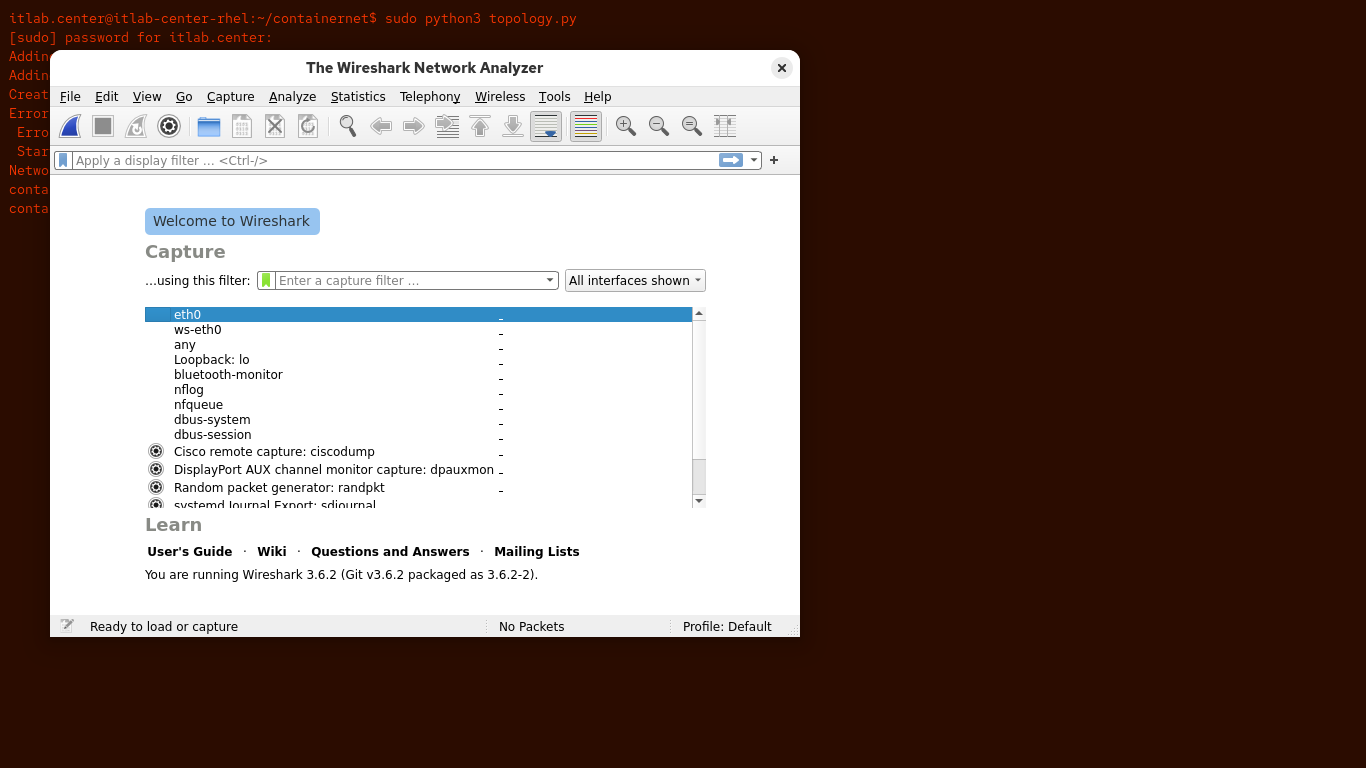
2. The Wireshark GUI
You won't be spending a lot of time on this first screen, but you will see it each time opening Wireshark
Featured in the center is a list of all the available network interfaces to perform packet capture from:
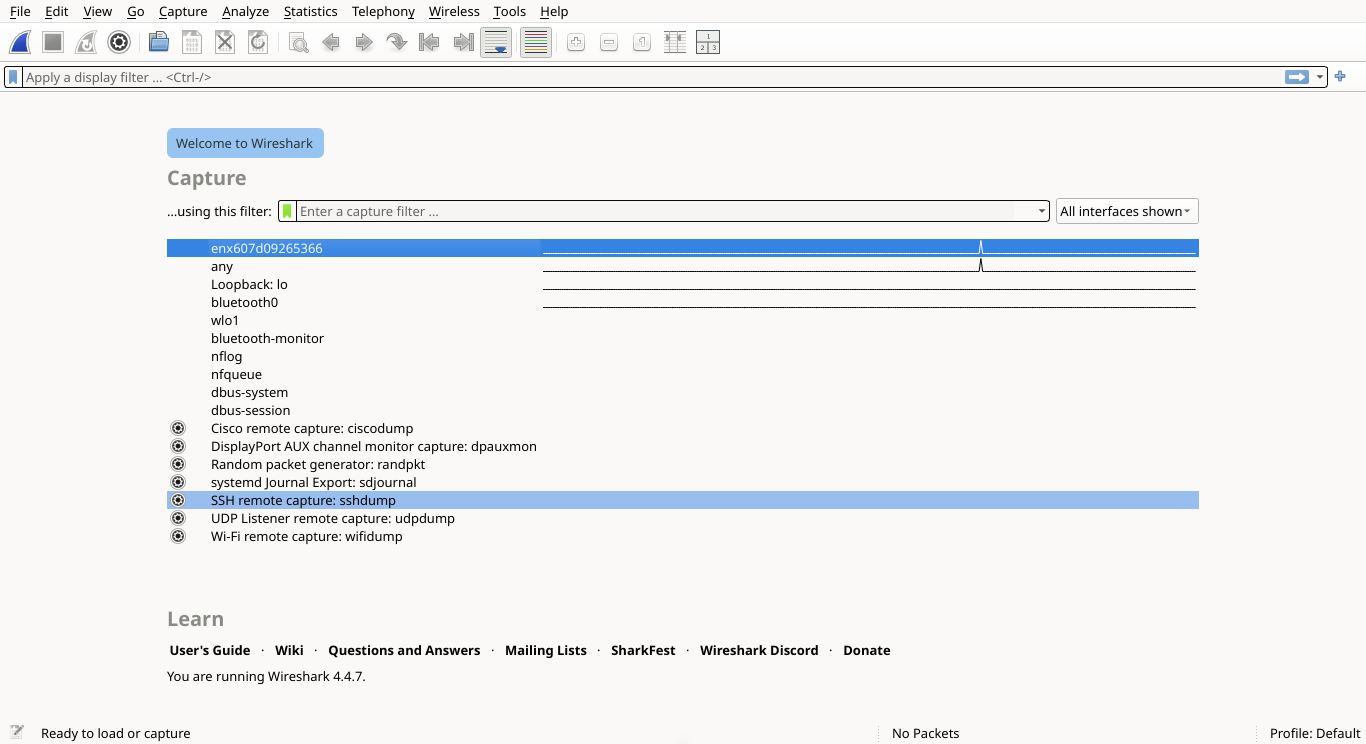
This includes any interfaces Wireshark recognizes on your device, as well as some special implementations
In fact Wireshark has an extremely varied diet, an can capture much more than just ethernet information
Some additional media types include Bluetooth, USB, Serial, NFC, Virtual Interfaces and even Wireless LAN
You can find the full matrix of supported media at https://wiki.wireshark.org/CaptureSetup/NetworkMedia
Media sorted by OS. Above the list of network interfaces you will find the Wireshark Capture Filter Bar:
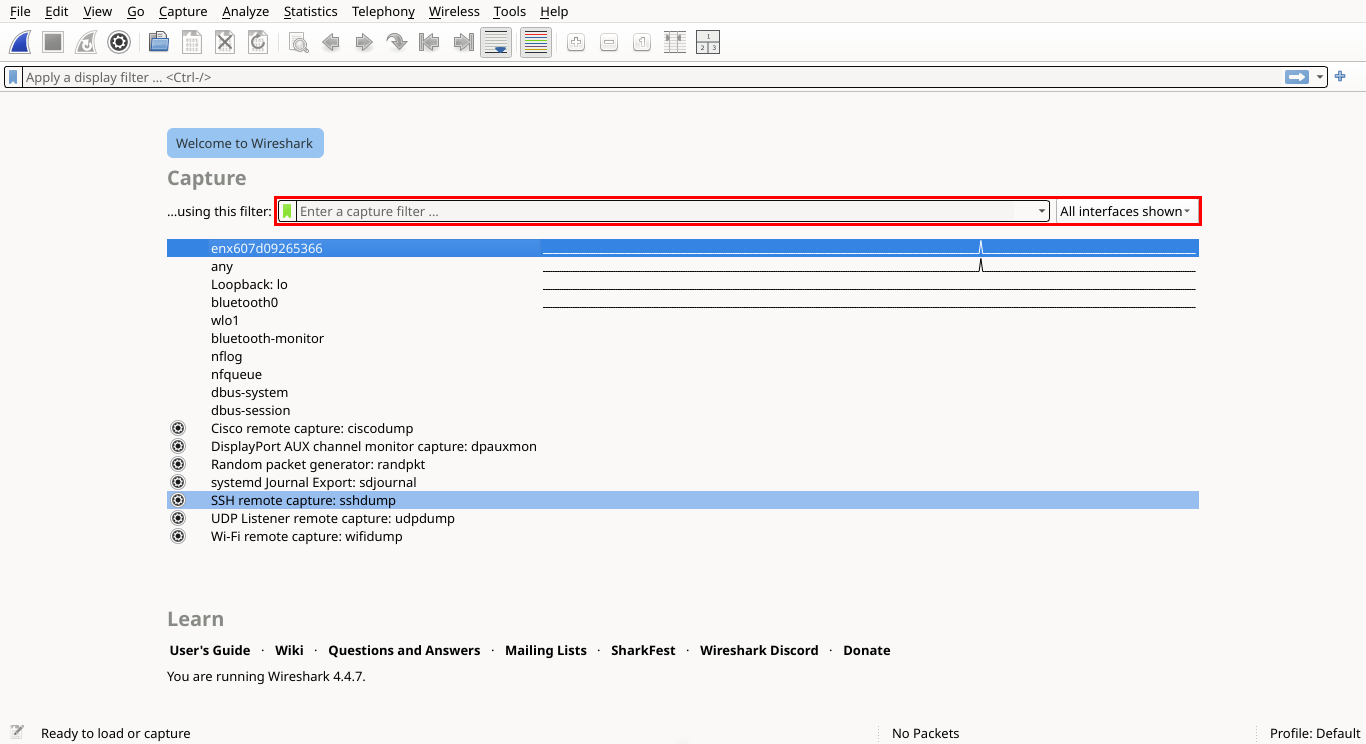
Part of what makes Wireshark so powerful is its Filter Expressions, allowing you to filter your packets
These allow you to select for packets that satisfy specific criteria, such as protocol, IP and MAC address
This capture filter bar allows you to specify criteria before starting your capture, recording specifics
However you are more often going to be filtering packets after your capture using the Display Filter Bar:
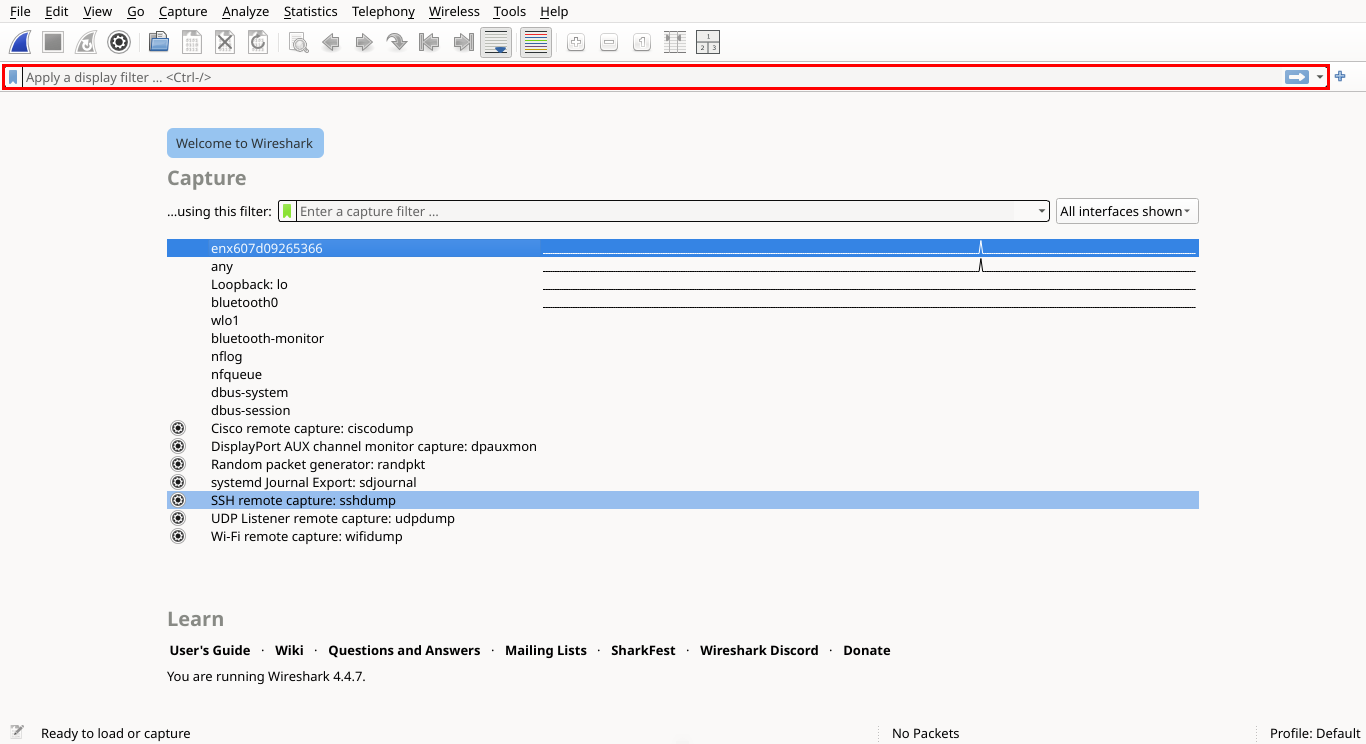
This lets you capture all traffic and then selectively display what matter most, you've got two filters
• Capture Filter - Only capture packets that match your filter
• Display Filter - Capture everything, but only display packets that match your filter
Once you start your capture, you'll land in the main Wireshark window, you should get used to this view
This is your new home, where you'll spend the large majority of your time during network packet analysis:
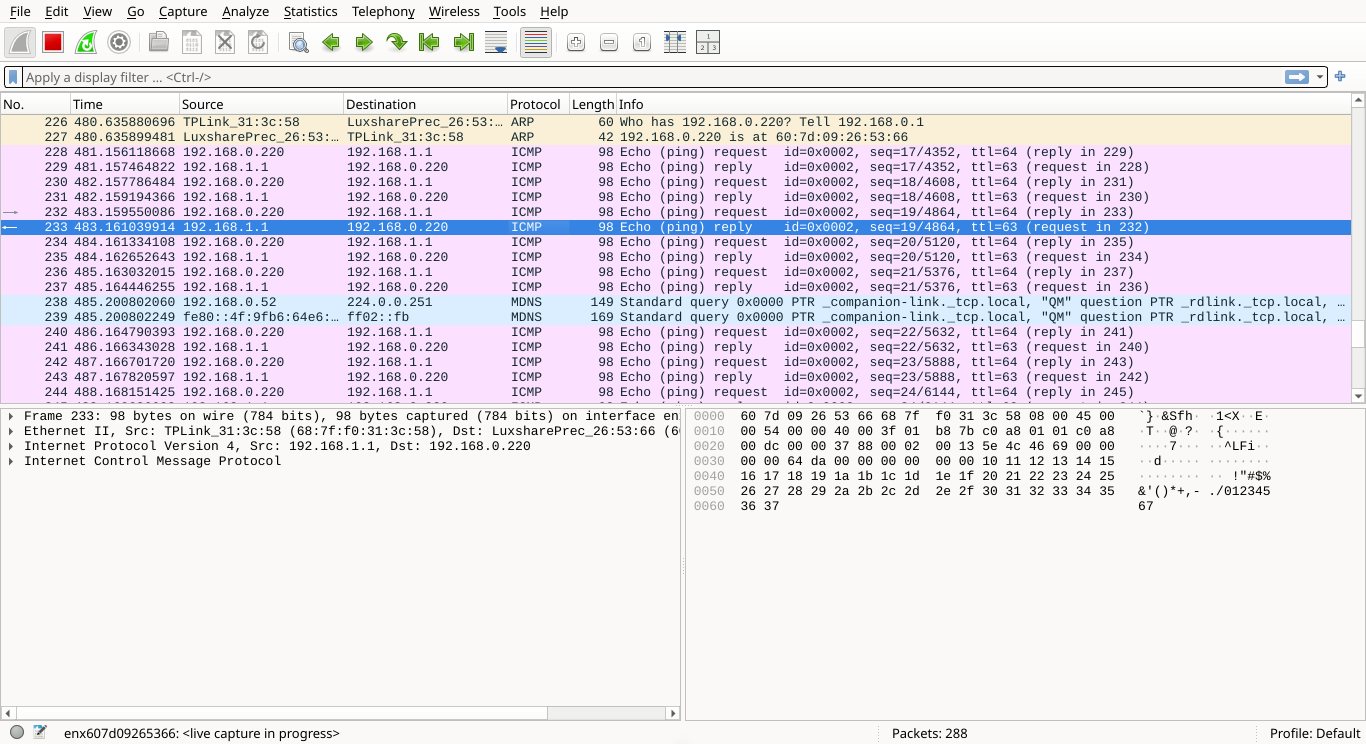
This screen consists of three panes, each providing a different level of detail about captured packets
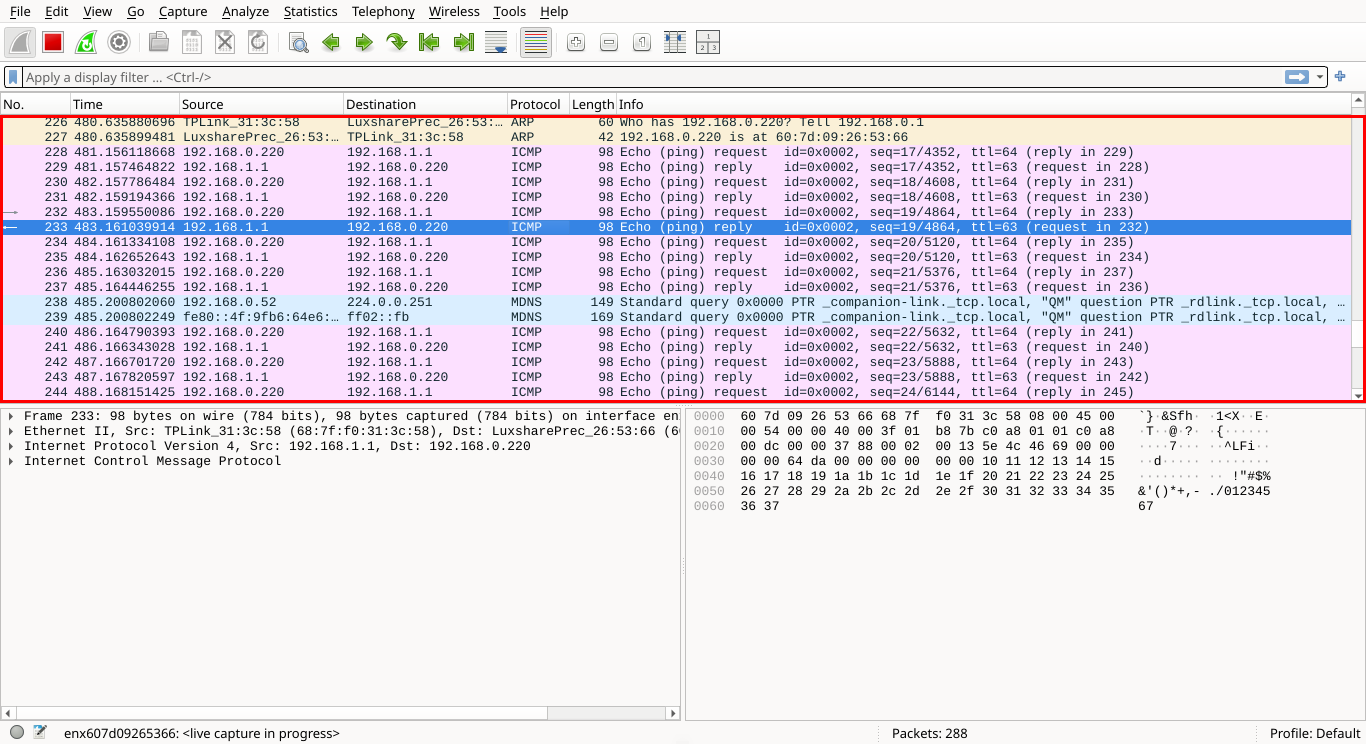
This pane displays a chronological list of captured packets. Each row represents a packet and contains
various columns showing identifying information, such as protocol type, destination address and summary
The Info column provides a quick-glance overview of each individual packet's role in the communication:
Selecting any one of the network packets will populate the additional panes below with more information
Here, you'll see a breakdown of the selected packet, displayed as a hierarchy of encapsulated protocols
Network data is structured like nesting dolls, where lower-level protocols wrap around higher-level ones
While this pane might seem intimidating at first, it becomes invaluable as your progress in your journey:
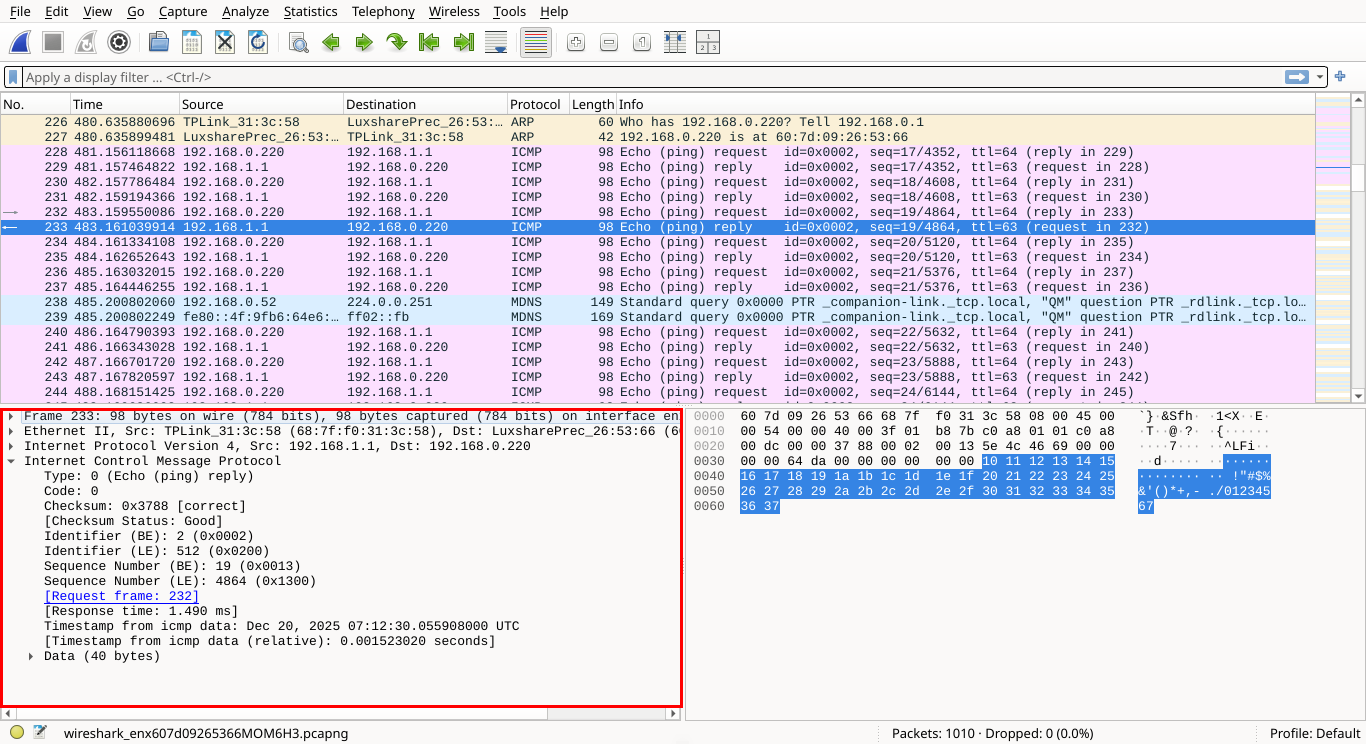
Selecting a field or line in the packet details pane highlights the corresponding bytes in the next pane
This area shows the raw data of the selected network packet, displayed in hexadecimal and ASCII formats
Most of the data may look like gibberish, but when dealing with unencrypted traffic, you can extract info:
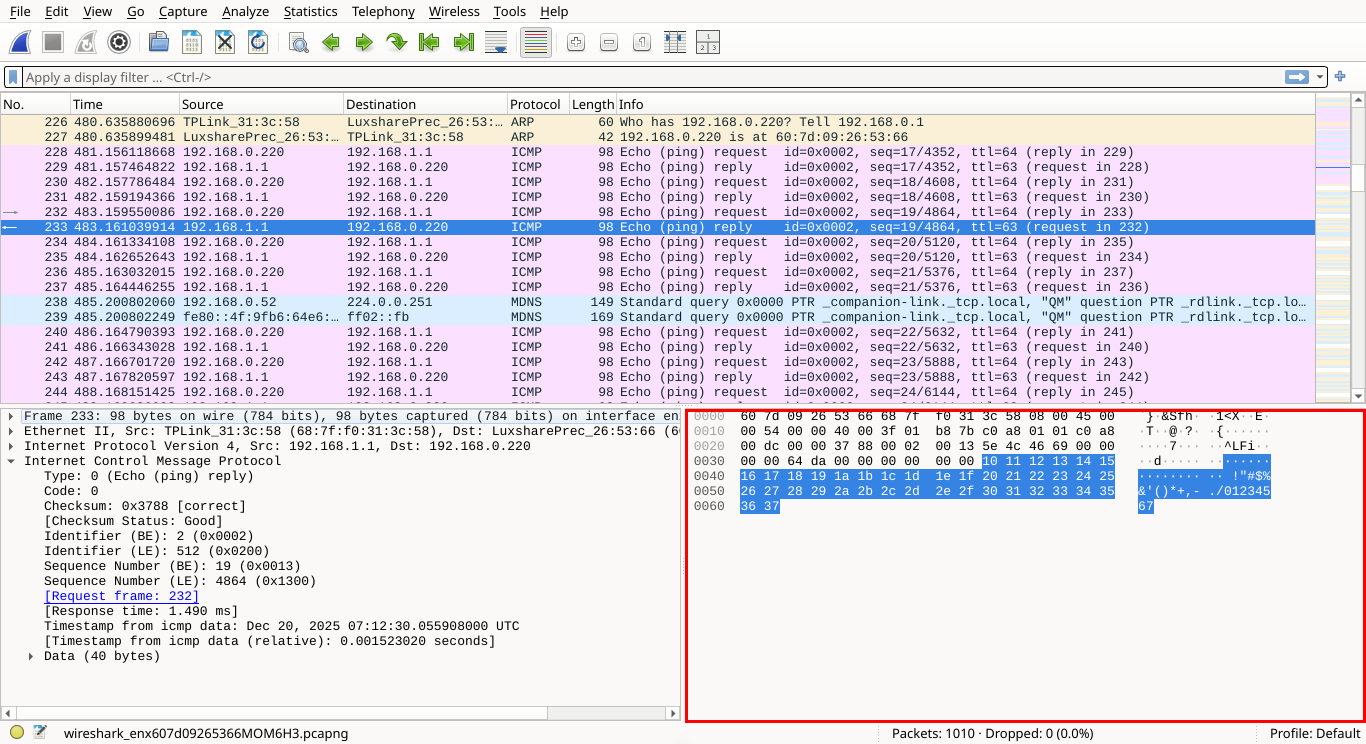
Hovering over specific bytes in the Packet Bytes pane highlights the corresponding field in Packet Details
At first glance, Wireshark might seem complex. But once you're comfortable reading packets it opens doors
This isn't just an academic exercise, it's a powerful tool for understanding what's happening on the wire
No matter what cybersecurity role you land, knowing your way around Wireshark will serve you very well
You can find additional UI details at https://www.wireshark.org/docs/wsug_html_chunked/ChapterUsing.html
3. Wireshark Filter Expressions
Much of your time in Wireshark will be spent using filters to refine your captures, so get comfortable
We'll practice them in the next lesson, but let's prime you with a few examples of filter expressions:
• http - Show me all HTTP traffic
• ip.src == 192.168.0.1 - Show me packets sent from the IP address 192.168.0.1
• ip.dst == 192.168.0.1 - Show me packets sent to the IP address 192.168.0.1
• ether.addr == 00:01:02:03:04:05 - Show me packets sent to the MAC address 00:01:02:03:04:05
• tcp.port == 22 - Show me packets sent to or from TCP port 22 (SSH)
We can also combine these filters using various logical operators:
• https or dns - Show me all traffic that is either HTTP or DNS
• !(arp or icmp or dns) - Exclude all packets that are ARP, ICMP, or DNS
Wireshark even provides shorthand filters for common combinations:
• ip.addr == 192.168.0.1 - Show me packets sent to or from 192.168.0.1
This is equivalent to: ip.src == 192.168.0.1 or ip.dst == 192.168.0.1
Wireshark uses filters for much of it's functionality. They are an incredibly useful and powerful tool
Sometimes you'll perform an action, and Wireshark will automatically populate your bar with expressions
Other times, the applications is using filters expressions behind the scenes to improve your experience
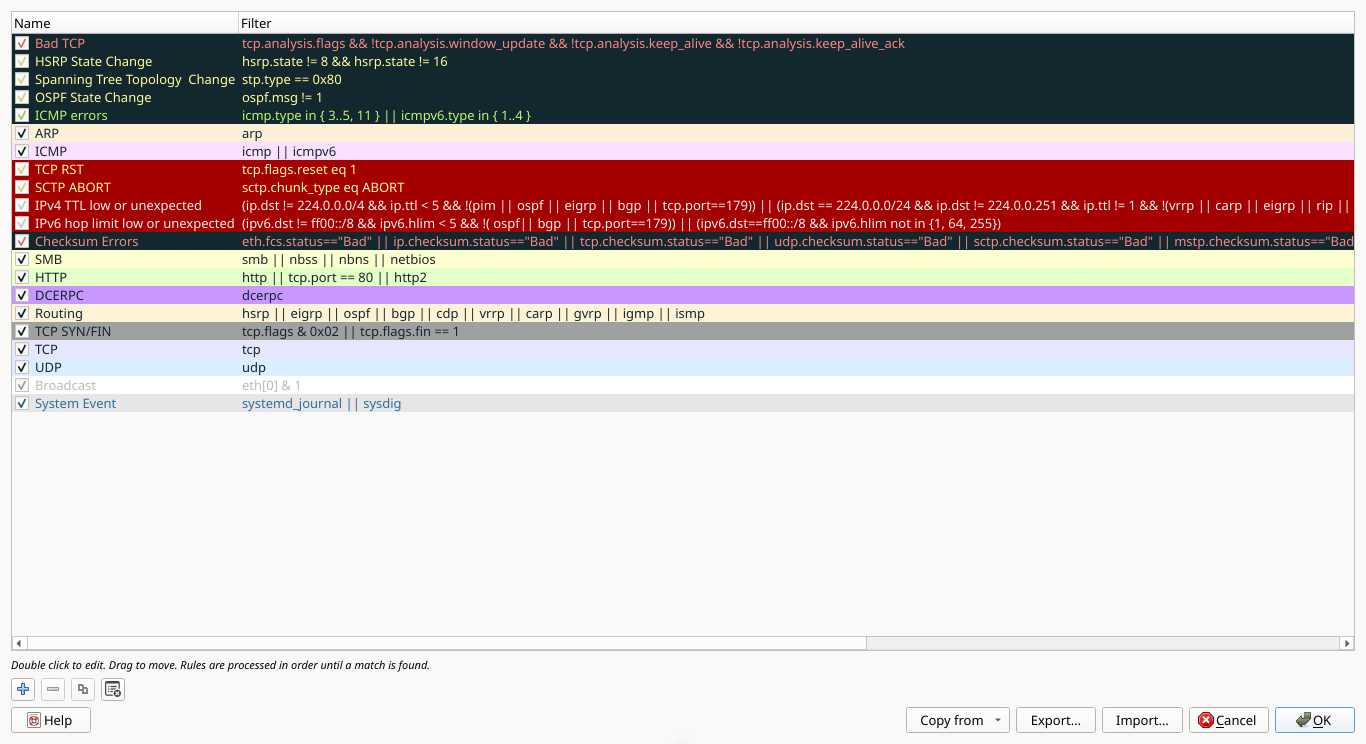
For example, those colored rows in your Packet List view? The colors are applied according to filter rules
which you can confirm by selecting the View > Coloring Rules... from the Wireshark Applications toolbar:
In the next lesson, you will begin your transformation into a wire shark - or at least a capable fish
4. Install Red Hat Enterprise Linux
Red Hat Enterprise Linux is a database level proprietary linux distribution maintained by the Red Hat Co
It is a commercial, enterprise-grade linux operating system designed to provide stability for businesses
The high-performance foundation is widely used across industries for both servers and cloud environments
We will be using RHEL for this lab to simulate performing a packet inspection on an enterprise network:
Download RHEL with Developer Subscription: RHEL 10.0 ISO File
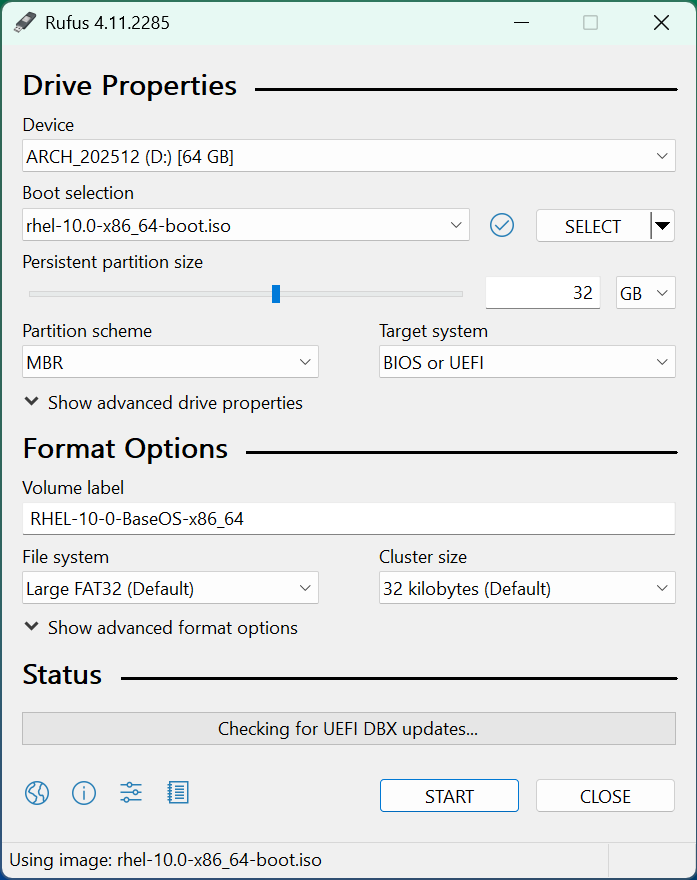
Download Rufus Disk Imaging Software: Rufus Official Download
Insert USB Flash Drive, run rufus.exe, select target drive as your USB Flash Drive, select RHEL 10.0 ISO:
Remove the USB Flash Drive and Insert into unused PC. Start PC and press the hot boot key at the startup:
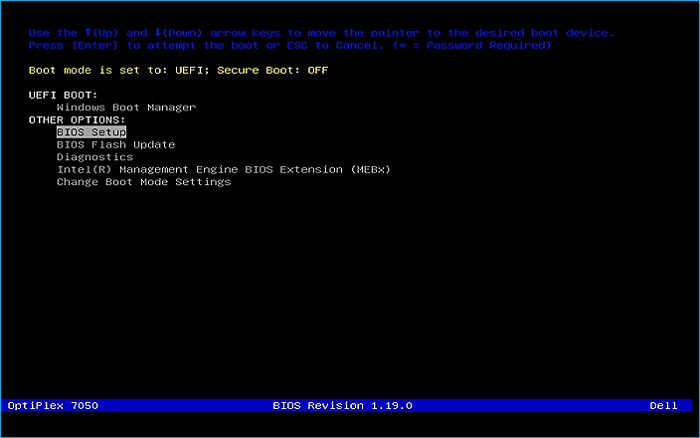
You will be greeted with the GRUB bootloader screen, select the option to Install Red Hat Linux v10.0:

This will load the GUI installer, click continue to use the default english language and keyboard layout:
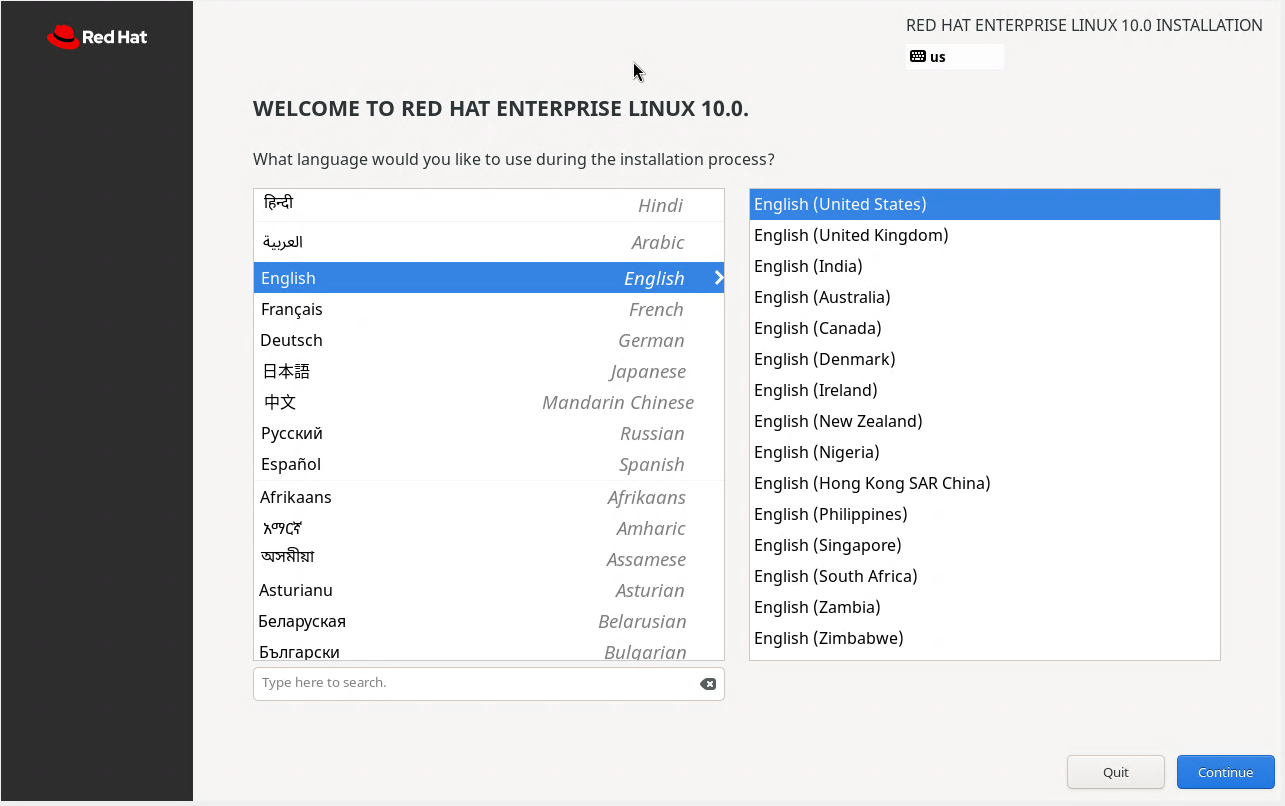
As a commercial operating system, we can see that the graphical installer is extremely visually polished
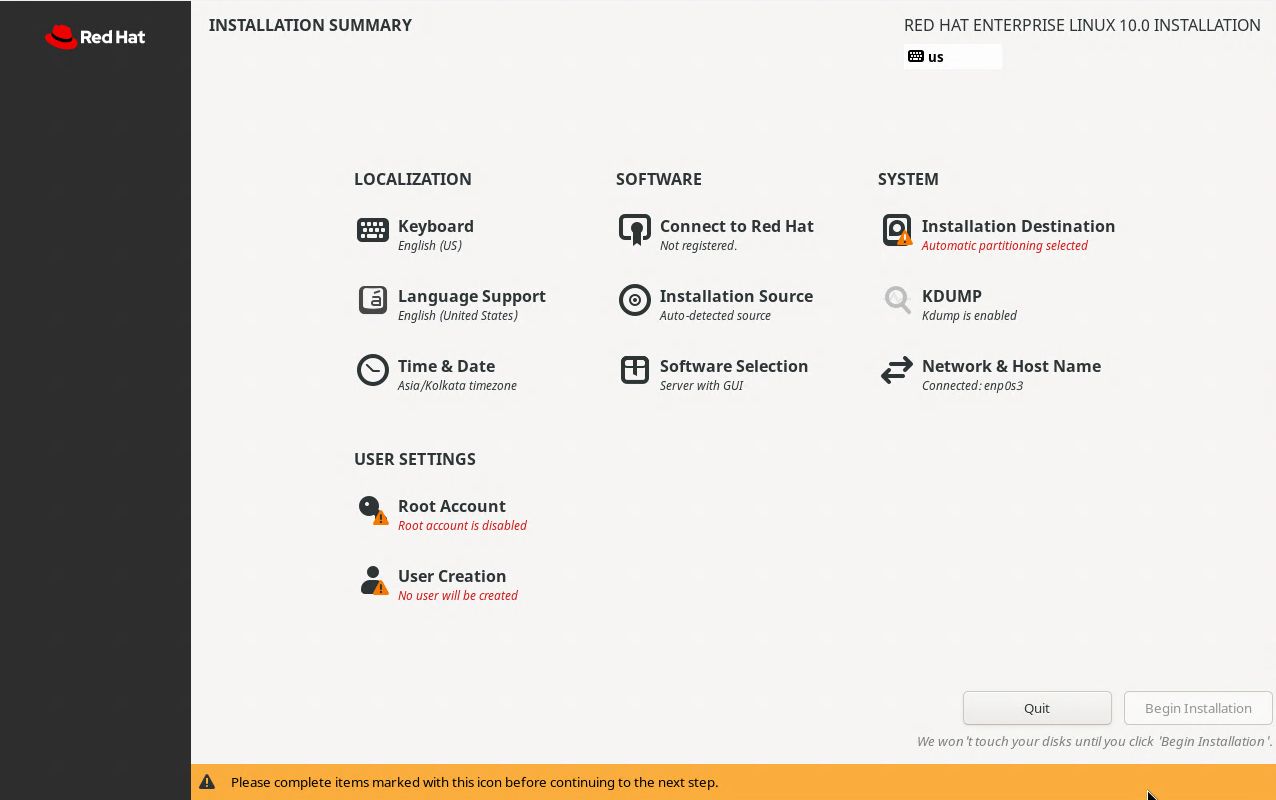
Under the Software Settings, click the option to Connect to Red Hat to allow for software installation
An authentication dialogue box will appear, enter in your credentials for your Red Hat developer account
Leave unchecked the options to set system purpose and connect to Red Hat insights, then click register
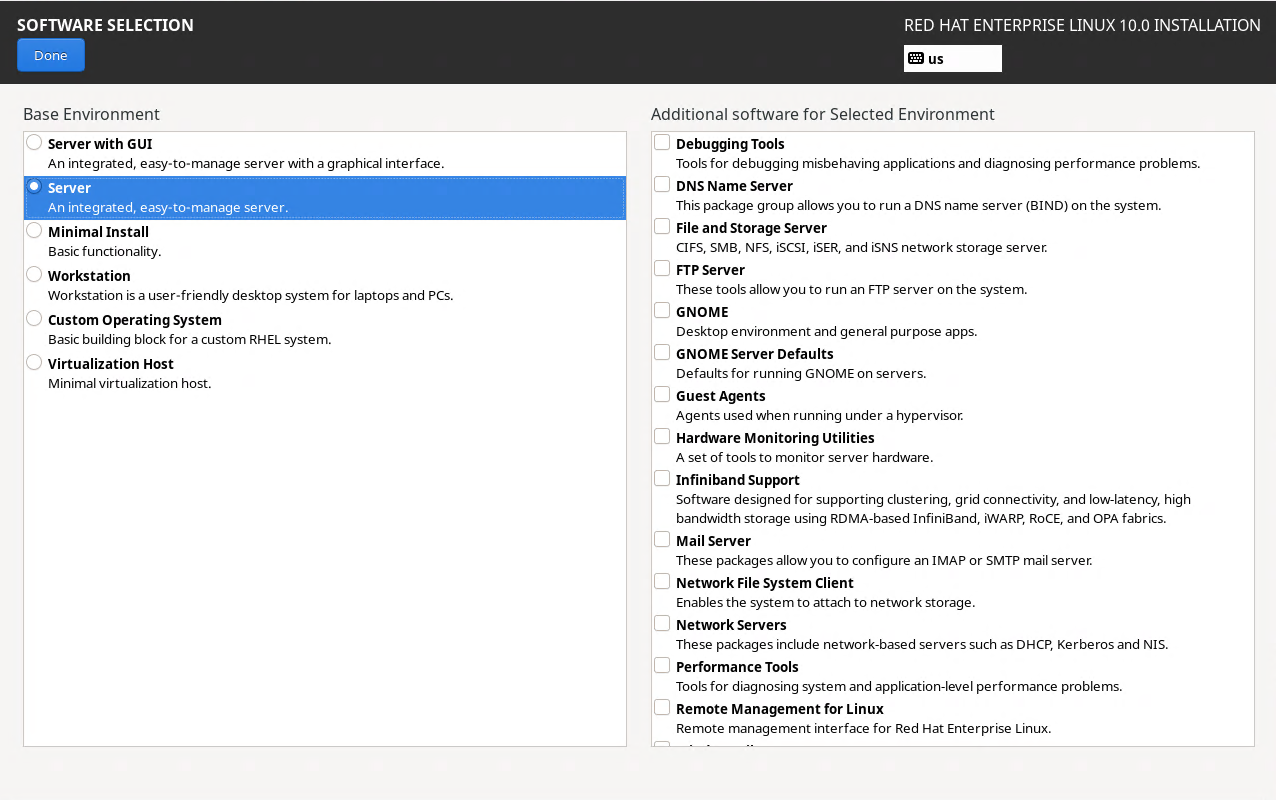
Click done to be returned to the main RHEL installation screen, from here click on the Software Selection
From the leftmost pane, select the options to install the Server with GUI Base Environment and click done
While Red Hat Enterprise Linux includes a variety of software bundles, we will install the tools ourself:
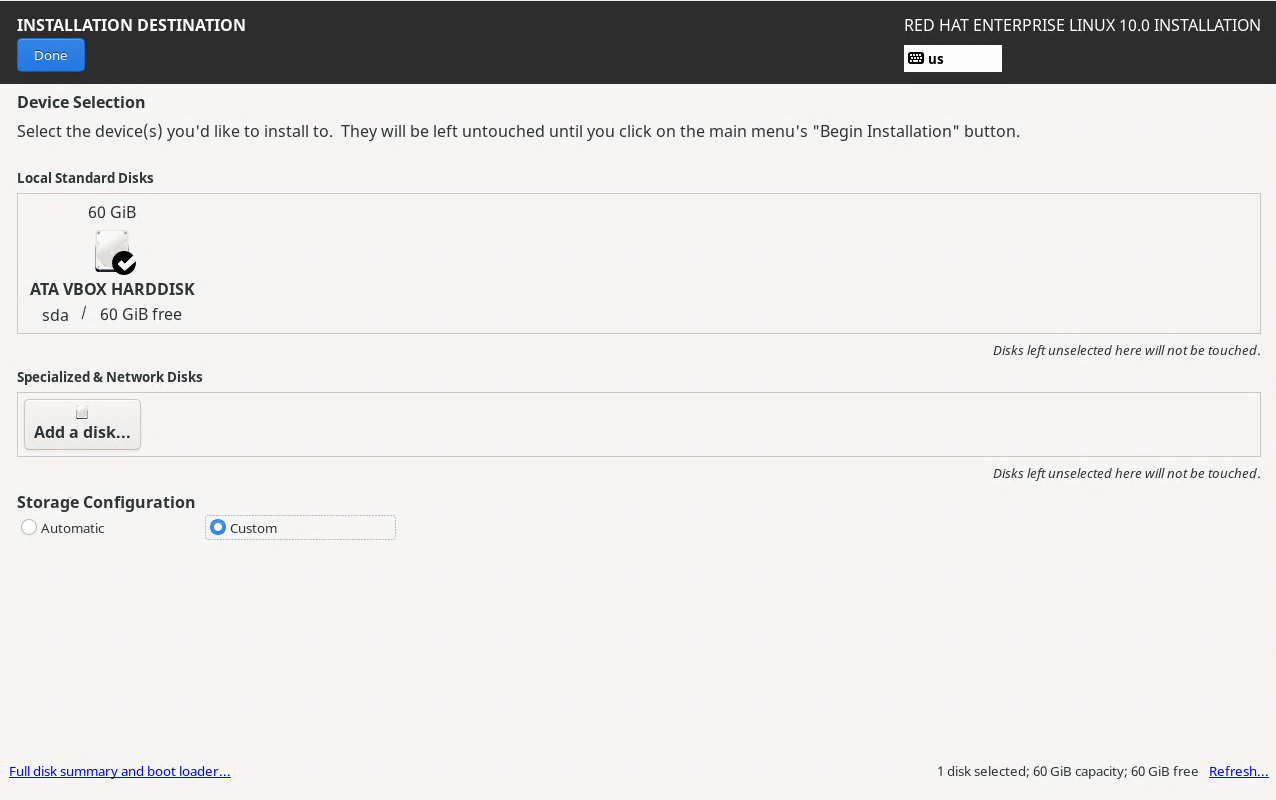
Next from the main installation screen, under the system options, click the installation destination tab
From here select the disk we will be installing to, check the box to Free up space by removing partitions
Click done, a menu for disk partitioning will appear, select the option to delete all and reclaim space:
Select the network settings option, enter in the hostname itlab-center-rhel at the bottom and click apply
Lastly, make sure to enable the root account and create a user account named itlab.center, begin install
Our operating system will take some time to install, once the installation is complete, click reboot system
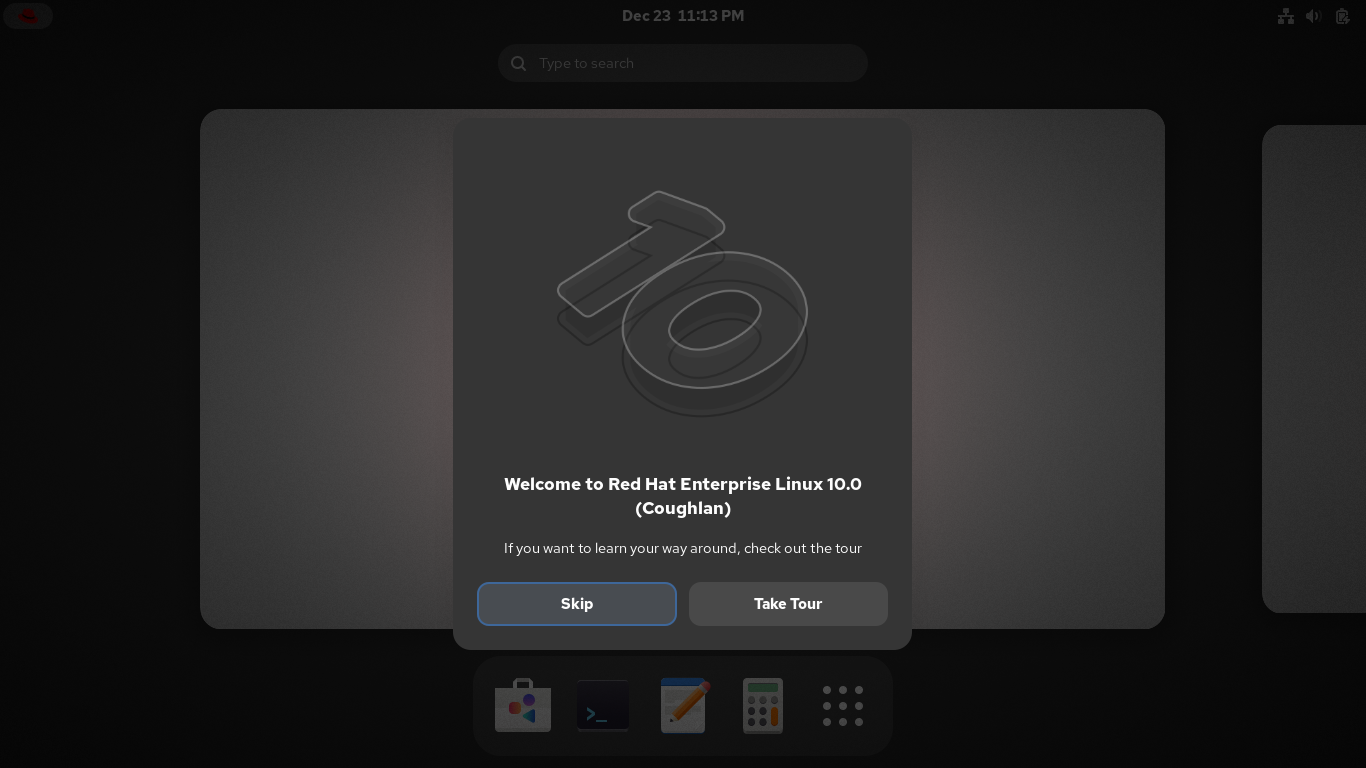
We now have our base system to complete the rest of this lab exercise from, and a powerful one at that
5. Install Lab Tools
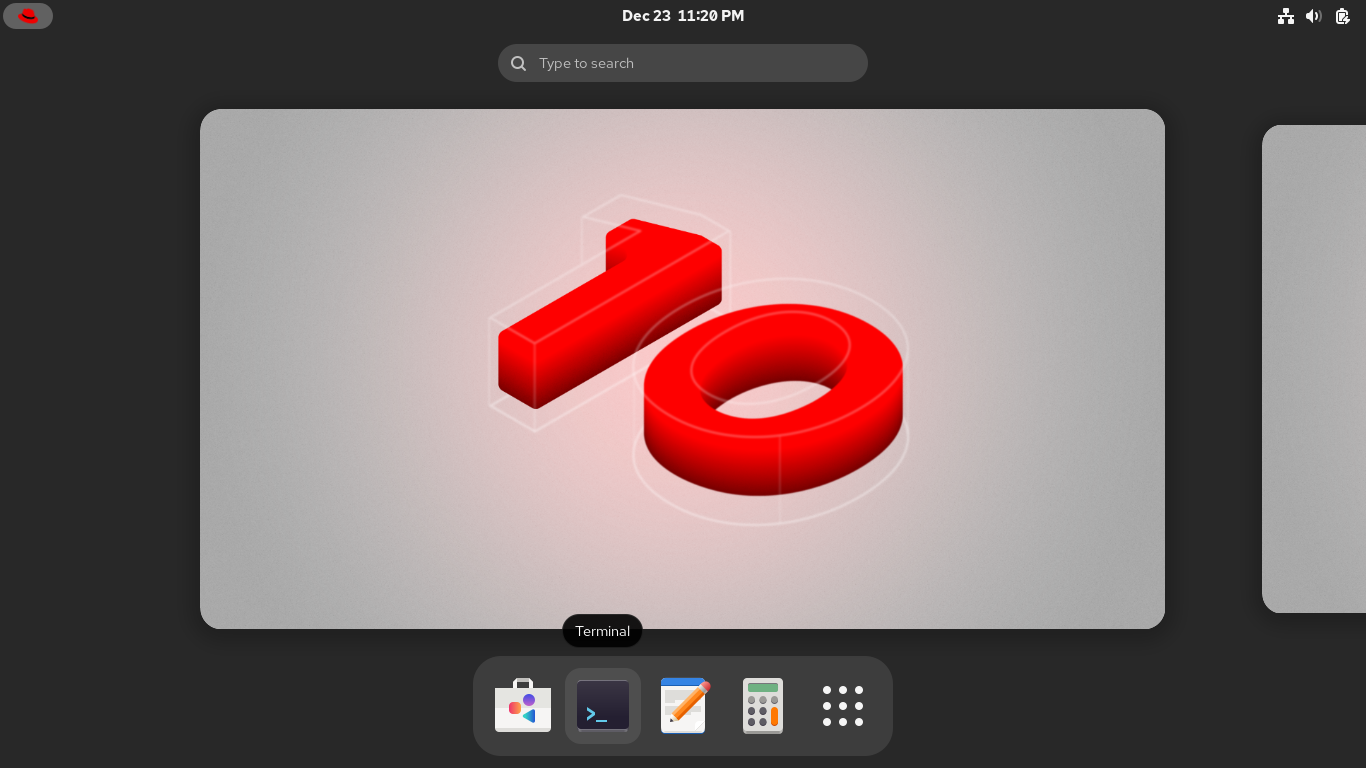
Now that we have our platform, let's build upon it by installing the rest of the tools for this activity
To begin, we want to open a terminal from the bottom of the screen, we will spend most of our time here:
Docker is a container deployment tool which we will use in this lab to create virtual network environments
Run the following commands from the Red Hat Enterprise Linux Terminal to install and enable docker service:
itlab.center@itlab-center-rhel:~$ sudo dnf install dnf-plugins-core -y
itlab.center@itlab-center-rhel:~$ sudo dnf config-manager --add-repo https://download.docker.com/linux/rhel/docker-ce.repo
itlab.center@itlab-center-rhel:~$ sudo dnf install docker-ce docker-ce-cli containerd.io docker-buildx-plugin docker-compose-plugin -y
itlab.center@itlab-center-rhel:~$ sudo systemctl enable --now docker
Xterm is a terminal emulator which will allow use to access the command line from our docker containers
Run the following command from the Red Hat Enterprise Linux terminal to install Xterm and our Wireshark:
itlab.center@itlab-center-rhel:~$ sudo dnf install xterm xhost wireshark -y
Containernet is a network emulator and allows us to use docker containers as hosts in emulated topologies
Python is a multi-purpose scripting language and git allows us to use the plethora of tools on Github.com
Run the following commands from the Red Hat Enterprise Terminal to install Containernet and dependencies:
itlab.center@itlab-center-rhel:~$ sudo dnf install gcc make glibc-devel telnet autoconf -y
itlab.center@itlab-center-rhel:~$ sudo dnf install python3 python3-pip git automake -y
itlab.center@itlab-center-rhel:~$ git clone https://github.com/containernet/containernet
itlab.center@itlab-center-rhel:~$ cd containernet
Run the following commands from the Red Hat Enterprise Linux Terminal to compile the mnexec dependency:
itlab.center@itlab-center-rhel:~/containernet$ sudo pip3 install .
itlab.center@itlab-center-rhel:~/containernet$ sudo make mnexec
itlab.center@itlab-center-rhel:~/containernet$ sudo cp mnexec /usr/bin/
itlab.center@itlab-center-rhel:~/containernet$ sudo chmod +x /usr/bin/mnexec
The installation script for containernet is not updated for RHEL 10, it will work but we must make changes
Run the following command from the Red Hat Enterprise Linux Terminal to open the install.sh file with nano:
itlab.center@itlab-center-rhel:~/containernet$ sudo nano util/install.sh
Now scroll to find the lines listed below and comment them out by adding preceding hashtags just like such:
# if ! which lsb_release &> /dev/null; then
# $install redhat-lsb-core
# fi
Almost there, find these lines and comment them out as well, then save with CTRL+O and exit with CTRL+X:
# patch -p1 < $MININET_DIR/containernet/util/openflow-patches/controller.patch
# patch -p1 < $MININET_DIR/containernet/util/openflow-patches/strlcpy.patch
Now run the following command from the Red Hat Enterprise Linux Terminal to install the ContainerNet tool:
itlab.center@itlab-center-rhel:~/containernet$ sudo util/install.sh -a
Since we have ContainerNet installed, we can move on to building the container images for our docker nodes
In this lab environment we will simulate a topology with a web, file, and utils server, plus a workstation
Each container is deployed with an image file which we can customize to select the software we'll include
Run the following command from the Red Hat Enterprise Linux Terminal to begin building our web server node:
itlab.center@itlab-center-rhel:~/containernet$ sudo nano Dockerfile-web
Our web server will run Ubuntu Linux as the OS and NGINX as the web server, type out the below and save:
FROM ubuntu:22.04
RUN apt-get update && apt-get install -y iproute2 iputils-ping nginx && rm /var/www/html/index.nginx-debian.html
RUN echo "<html><body><h1>ITLab.Center</h1><p>You are not logged in</p><p><a href='login.html'>Click here to log in</a></p></body></html>" >> /var/www/html/index.html
RUN echo "<html><body><form action='home.html'><label for='username'>Username:</label><br>" >> /var/www/html/login.html
RUN echo "<input type='text' id='username'><br><label for='password'>Password:</label><br><input type='text' id='password'><br>" >> /var/www/html/login.html
RUN echo "<input type='submit' value='Submit'></form></body></html>" >> /var/www/html/login.html && echo "run.MaliciousScript()" >> /var/www/html/ComputerCleaner.elf
RUN echo "<html><head><script>window.onload=function(){const a=document.createElement('a');a.href='ComputerCleaner.elf';" >> /var/www/html/home.html
RUN echo "a.download='ComputerCleaner.elf';document.body.appendChild(a);a.click();document.body.removeChild(a);}" >> /var/www/html/home.html
RUN echo "document.cookie='username=webuser; path=/';document.cookie='password=password123; path=/';fetch('/ping');</script></head>" >> /var/www/html/home.html
RUN echo "<body><h1>ITLab.Center</h1><p>You are logged in</p><p><a href='logout.html'>Click here to log out</a></p></body></html>" >> /var/www/html/home.html
RUN echo "<html><body><h1>ITLab.Center</h1><p>You are not logged in</p><p><a href='login.html'>Click here to log in</a></p></body></html>" >> /var/www/html/logout.html
RUN echo "server {" > /etc/nginx/sites-available/default && echo "listen 80;" >> /etc/nginx/sites-available/default
RUN echo "server_name _;" >> /etc/nginx/sites-available/default && echo "root /var/www/html;" >> /etc/nginx/sites-available/default
RUN echo "index index.html;" >> /etc/nginx/sites-available/default && echo "location ~ \.elf$ {" >> /etc/nginx/sites-available/default
RUN echo "add_header Content-Type application/octet-stream;" >> /etc/nginx/sites-available/default
RUN echo "add_header Content-Disposition 'attachment';" >> /etc/nginx/sites-available/default && echo "}" >> /etc/nginx/sites-available/default
RUN echo "location / {" >> /etc/nginx/sites-available/default && echo "try_files \$uri \$uri/ =404;" >> /etc/nginx/sites-available/default
RUN echo "}" >> /etc/nginx/sites-available/default && echo "}" >> /etc/nginx/sites-available/default
CMD ["nginx", "-g", "daemon off;"]
Run the following command from the Red Hat Enterprise Linux Terminal to begin building our file server node:
itlab.center@itlab-center-rhel:~/containernet$ sudo nano Dockerfile-file
Our file server will run Ubuntu Linux as the OS and vsftpd as the file server, type out the below and save:
FROM ubuntu:22.04
RUN apt-get update && apt-get install -y vsftpd ftp iproute2 iputils-ping
RUN mkdir -p /var/run/vsftpd/empty
RUN mkdir -p /var/ftp && useradd -d /var/ftp ftpuser && echo "ftpuser:password123" | chpasswd
RUN mkdir -p /home/user && echo "local_root=/home/user" >> /etc/vsftpd.conf && echo "password123" >> /home/user/passwords.txt
CMD ["/usr/bin/vsftpd", "/etc/vsftpd.conf"]
Run the following command from the Red Hat Enterprise Linux Terminal to begin building a utils server node:
itlab.center@itlab-center-rhel:~/containernet$ sudo nano Dockerfile-utils
Our utils server will run Ubuntu Linux as the OS and includes networking tools, type out the below and save:
FROM ubuntu:22.04
RUN apt-get update && apt-get install -y iproute2 iputils-ping telnetd xinetd
RUN useradd -m -d /home/utiluser -s /bin/bash utiluser && echo "utiluser:password123" | chpasswd
RUN echo 'service telnet' >> /etc/xinetd.d/telnet && echo '{' >> /etc/xinetd.d/telnet && echo 'disable = no' >> /etc/xinetd.d/telnet
RUN echo 'flags = REUSE' >> /etc/xinetd.d/telnet && echo 'socket_type = stream' >> /etc/xinetd.d/telnet && echo 'wait = no' >> /etc/xinetd.d/telnet
RUN echo 'user = root' >> /etc/xinetd.d/telnet && echo 'server = /usr/sbin/in.telnetd' >> /etc/xinetd.d/telnet
RUN echo 'log_on_failure += USERID' >> /etc/xinetd.d/telnet && echo '}' >> /etc/xinetd.d/telnet && echo 'itlab.center.prod' >> /home/utiluser/servers.txt
RUN echo 'itlab.center.dev' >> /home/utiluser/servers.txt && echo 'itlab.center.web' >> /home/utiluser/servers.txt
RUN echo 'itlab.center.dashboard' >> /home/utiluser/servers.txt && echo 'itlab.center.wiki' >> /home/utiluser/servers.txt
CMD ["/usr/sbin/xinetd"]
Run the following command from the Red Hat Enterprise Linux Terminal to begin building a workstation node:
itlab.center@itlab-center-rhel:~/containernet$ sudo nano Dockerfile-workstation
Our workstation will run Ubuntu as the OS and will include xterm and wireshark, type out the below and save:
FROM ubuntu:22.04
RUN apt update && apt install -y wireshark xterm iputils-ping iproute2 ftp telnet wget xz-utils
RUN wget --content-disposition -L "https://download.mozilla.org/?product=firefox-latest&os=linux64&lang=en-US"
RUN tar xf firefox-*.tar.xz && mv firefox /opt/firefox && ln -s /opt/firefox/firefox /usr/local/bin/firefox
CMD ["bash"]
Run the following commands from the Red Hat Linux Terminal to build the Docker containers with our images:
itlab.center@itlab-center-rhel:~/containernet$ sudo docker build -t webserver -f Dockerfile-web .
itlab.center@itlab-center-rhel:~/containernet$ sudo docker build -t fileserver -f Dockerfile-file .
itlab.center@itlab-center-rhel:~/containernet$ sudo docker build -t utilsserver -f Dockerfile-utils .
itlab.center@itlab-center-rhel:~/containernet$ sudo docker build -t workstation -f Dockerfile-workstation .
We have all of the containers built with there respective images and software, let's move on to networking
6. Deploy Network Topology Emulation
We've put much thought into our node images, but they are useless if they don't communicate with each other
In this lab exercise we simulate the perspective of the network administrator performing packet inspection
Before we move forward let's have a birds eye view of what we are trying to emulate so you can understand:
+------------------+ +------------------+
| Web Server | | File Server |
| NGINX | | VSFTPD |
+---------+--------+ +---------+--------+
\ /
\ /
\ /
+--------------+
| Switch |
+--------------+
/ \
/ \
+---------+--------+ +------------------+
| Utils Server | | Workstation |
| TELNETD | | WIRESHARK + |
| | | FIREFOX |
+------------------+ +------------------+
In order for us to perform packet inspection, we need to connect these virtual containers with a switch
This will allow us to generate traffic between the nodes and study all the interactions that they create
Run the following commands from the Red Hat Enterprise Linux Terminal to compile our virtual switch source:
itlab.center@itlab-center-rhel:~/containernet$ sudo dnf install libtool openssl-devel python3-devel kernel-devel libcap-ng-devel -y
itlab.center@itlab-center-rhel:~/containernet$ git clone https://github.com/openvswitch/ovs.git
itlab.center@itlab-center-rhel:~/containernet$ cd ovs
itlab.center@itlab-center-rhel:~/containernet/ovs$ git checkout v3.3.0
The Open vSwitch is the optimal package choice here, being compatible with RHEL, docker and containernet
Run the following commands from the Red Hat Enterprise Linux Terminal to build the OVS tool from source:
itlab.center@itlab-center-rhel:~/containernet/ovs$ ./boot.sh
itlab.center@itlab-center-rhel:~/containernet/ovs$ ./configure
itlab.center@itlab-center-rhel:~/containernet/ovs$ make -j$(nproc)
itlab.center@itlab-center-rhel:~/containernet/ovs$ sudo make install
The OpenvSwitch commands are located in /usr/local/bin and /usr/local/sbin, we must add them to the PATH
Run the following commands from the Red Hat Enterprise Linux Terminal to edit the sudoers config file:
itlab.center@itlab-center-rhel:~/containernet/ovs$ sudo visudo
Scroll to the following line and add the paths by hitting i, entering them, hitting escape, them typing :wq
Defaults secure_path - /sbin:/bin:/usr/sbin:/usr/bin:/usr/local/bin:/usr/local/sbin
Last part we need to take care of before our virtual switch can begin routing packets and assigning IPs
Run the following commands from the Red Hat Enterprise Linux Terminal to perform the OVS database setup:
itlab.center@itlab-center-rhel:~/containernet/ovs$ sudo mkdir -p /usr/local/etc/openvswitch /usr/local/var/run/openvswitch
itlab.center@itlab-center-rhel:~/containernet/ovs$ sudo ovsdb-tool create /usr/local/etc/openvswitch/conf.db /usr/local/share/openvswitch/vswitch.ovsschema
itlab.center@itlab-center-rhel:~/containernet/ovs$ sudo ovsdb-server --remote=punix:/usr/local/var/run/openvswitch/db.sock --remote=db:Open_vSwitch,Open_vSwitch,manager_options --pidfile --detach
itlab.center@itlab-center-rhel:~/containernet/ovs$ sudo ovs-vswitchd --pidfile --detach
Now that our images are created, we are tasked with connecting them with virtual links to a network switch
This is precisely what ContainerNet is for, which uses Python scripting to create the emulated connections
Run the following commands from the Red Hat Enterprise Linux Terminal to create and edit our python script:
itlab.center@itlab-center-rhel:~/containernet/ovs$ cd ..
itlab.center@itlab-center-rhel:~/containernet$ nano topology.py
Type out the Python script below to perform calls to the Containernet modules and link the hosts virtually:
#!/user/bin/python3
from mininet.net import Containernet
from mininet.node import Controller, OVSBridge
from mininet.cli import CLI
from mininet.link import TCLink
from mininet.term import makeTerm
def build_topology():
net = Containernet(controller=Controller)
net.addController("c0")
print("Adding Docker containers...")
web = net.addDocker("web", ip="10.0.0.10", dimage="webserver")
file = net.addDocker("file", ip="10.0.0.20", dimage="fileserver")
utils = net.addDocker("utils", ip="10.0.0.30", dimage="utilsserver")
workstation = net.addDocker("ws", ip="10.0.0.40", dimage="workstation", environment={"DISPLAY": ":0"}, volumes=["/tmp/.X11-unix:/tmp/.X11-unix"])
print("Adding switch...")
s1 = net.addSwitch("s1", cls=OVSBridge)
print("Creating links...")
net.addLink(web, s1)
net.addLink(file, s1)
net.addLink(utils, s1)
net.addLink(workstation, s1)
print("Starting network...")
net.start()
print("Setting up interfaces...")
workstation.cmd("ip link set ws-eth0 up")
file.cmd("ip link set file-eth0 up")
utils.cmd("ip link set utils-eth0 up")
web.cmd("ip link set web-eth0 up")
print("Starting services...")
file.cmd("/usr/sbin/vsftpd /etc/vsftpd.conf &")
utils.cmd("/usr/sbin/xinetd &")
web.cmd("nginx")
workstation.cmd("echo 'ftp 21/tcp' >> /etc/services")
print("Mapping hostnames...")
workstation.cmd("echo '10.0.0.10 webserver.com' >> /etc/hosts")
workstation.cmd("echo '10.0.0.20 fileserver' >> /etc/hosts")
workstation.cmd("echo '10.0.0.30 utilserver' >> /etc/hosts")
print("Network ready. Use CLI to test.")
CLI(net)
net.stop()
if __name__ == "__main__":
build_topology()
This will create our lab environment and bring it live, use CTRL+O to save the script and CTRL+X to exit
Run the following command from the Red Had Enterprise Linux Terminal to enable containers to use GUI apps:
itlab.center@itlab-center-rhel:~/containernet$ xhost +
In this lesson you will apply what you learned in the overview and analyze network traffic with Wireshark
Before we proceed, we need to start the emulated network we have designed to begin performing inspection
Run the following command from the Red Hat Linux Terminal to start the xterm network topology emulation:
itlab.center@itlab-center-rhel:~/containernet$ sudo python3 topology.py
Once our script executes you will be greeted with a containernet prompt, run the following command from it:
containernet> ws wireshark&
Resulting Output:
Our setup is complete, let's move into the lab exercise to investigate how to use Wireshark for networking
7. Generate Network Traffic
In this part of the lab, you will generate network traffic that you will use to practice packet analysis
You will start as they all start, with ping, the "Hello World" of networking, like checking for a signal
You will make each host ping every other host in the environment to confirm that everyone is up and online
After that you will conducts a file transfer. gain remote access to a machine, and login to a web page
This should provide a balanced meal of packets for the new wireshark to perform network packet inspection
Starting from the Wireshark menu, select the Capture > Options to open the Capture Interfaces dialog box:
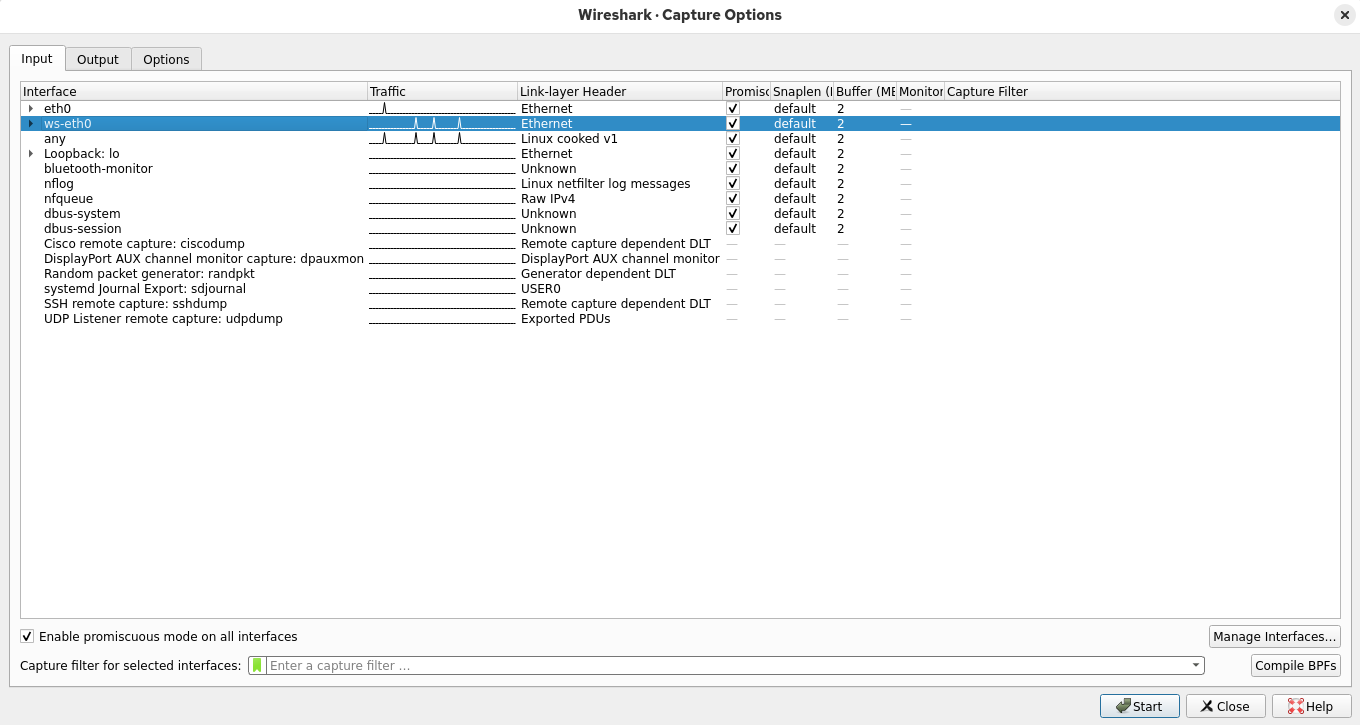
In the Capture Interfaces dialog box, select the ws-eth0 interface, then click start to begin the capture
Typically, captures will be run on network nodes, like switches and routers, rather than network endpoints
These devices are configured with a special port that pumps out copies of every packet that passes through
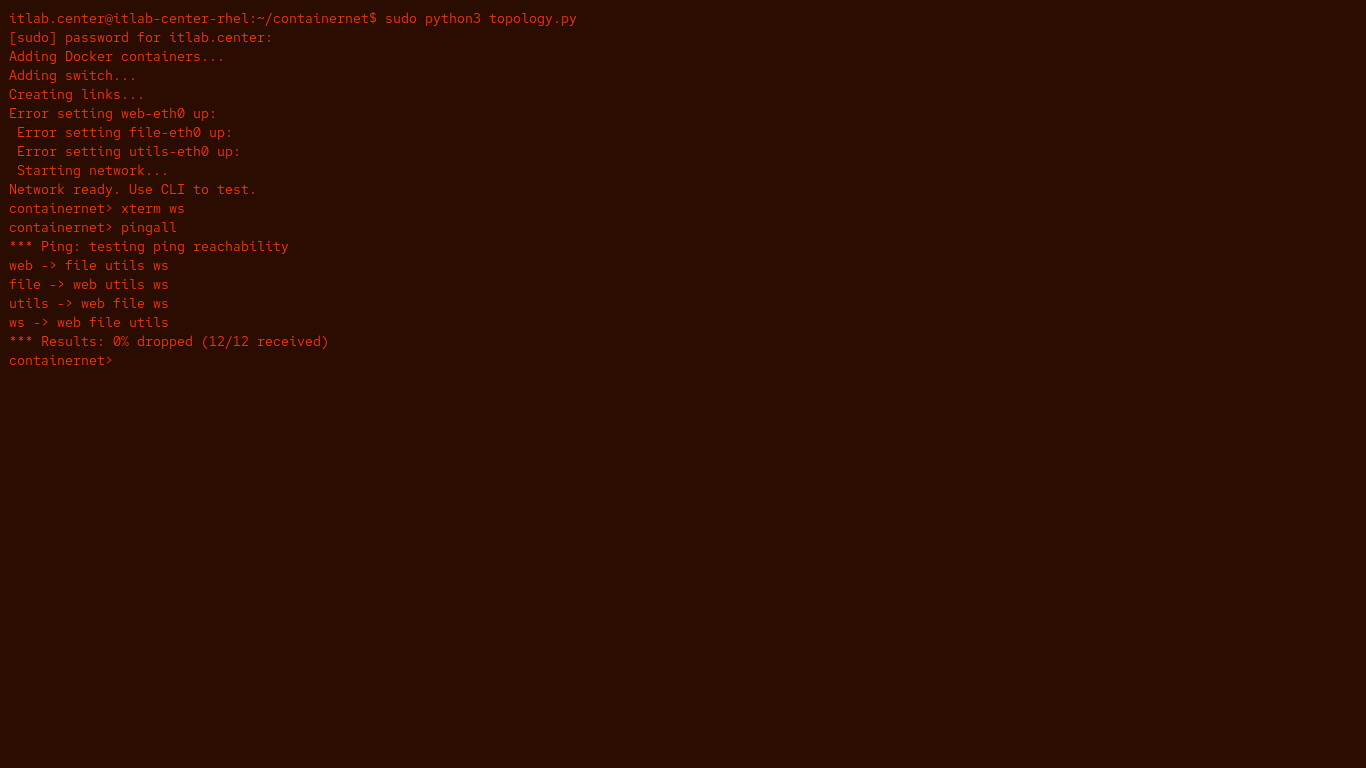
Run the following command from the Red Hat Enterprise Linux Terminal to ping each of the network nodes:
containernet> pingall
Resulting Output:
Now you will return to your workstation, ws, where you'll be transmitting the rest of your traffic from
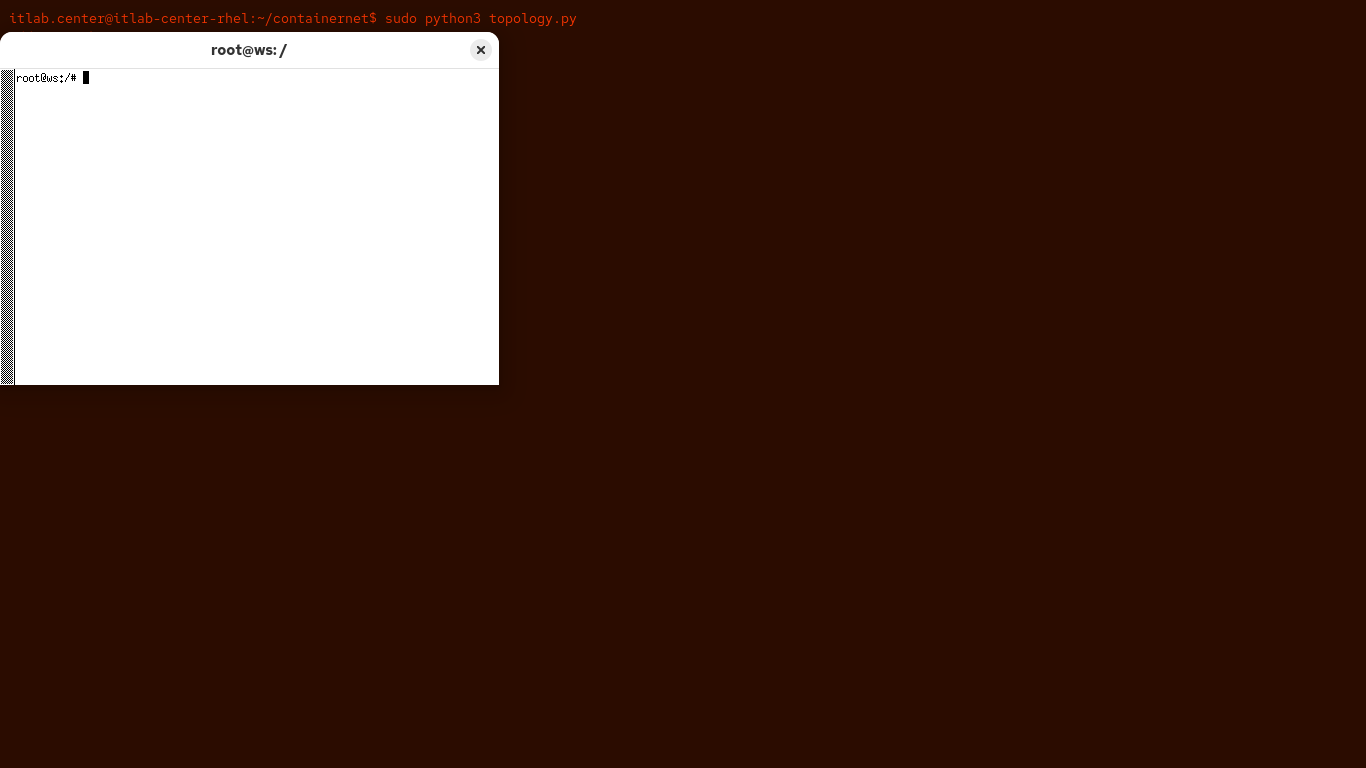
Run the following command from the Red Hat Enterprise Linux Terminal to open a virtual xterm on our ws:
containernet> xterm ws
Resulting Output:
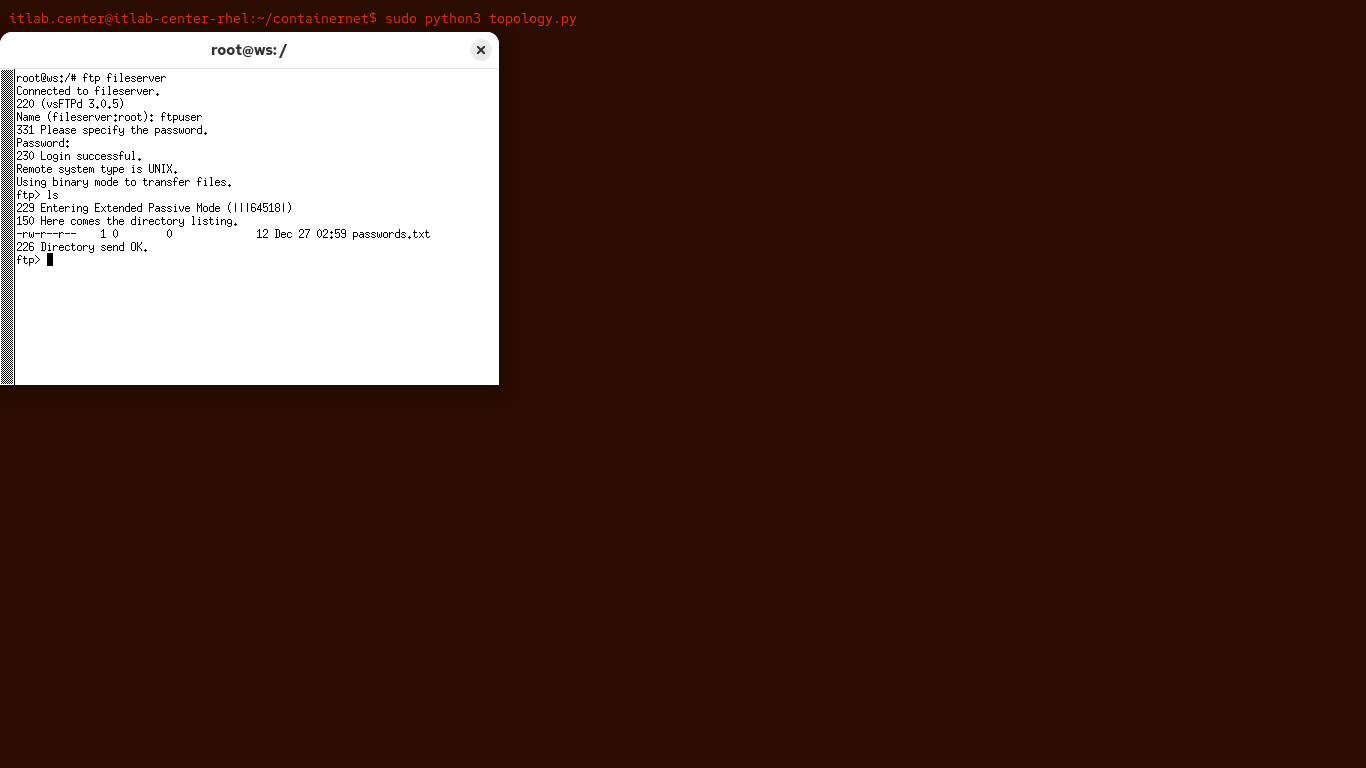
Run the following command from the Workstation Nodes Xterm Terminal to open a fileserver connection:
root@ws:/# ftp fileserver
When prompted, use the credentials we set up in the dockerfile to log in, which are ftpuser, password123
Once you are logged in you will be presented with an ftp prompt for the fileserver, type ls and hit enter:
Run the following command from the Workstation Nodes Xterm Terminal to download the passwords.txt file:
ftp> get passwords.txt
Resulting Output:
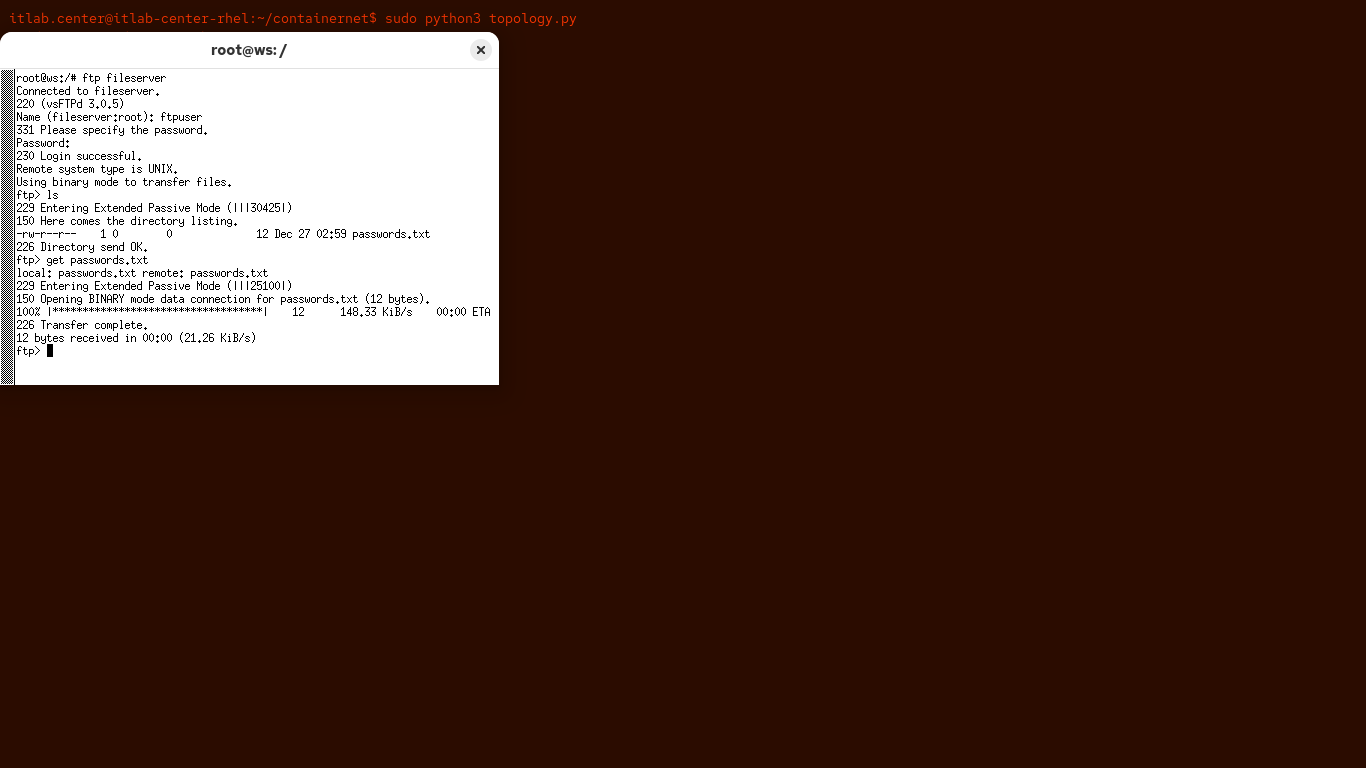
The 226 transfer complete message indicates that the download was successful, let's clean up after that
Run the following commands from the Workstation Nodes Xterm Terminal to remove the files and exit ftp:
ftp> delete passwords.txt
ftp> exit
Next you will generate traffic related to remote access protocols, you will utilize the primitive telnet
In practice, you should use a secure connection protocol like SSH so that your communication is encrypted
Telnet delivers data in plaintext for all to see, poor security, but excellent for lab based demonstrations
Run the following command from the Workstation Nodes Xterm Terminal to initiate a remote telnet session:
root@ws:/# telnet utilserver
When prompted, use the credentials we set up in the dockerfile to log in, which are utiluser, password123
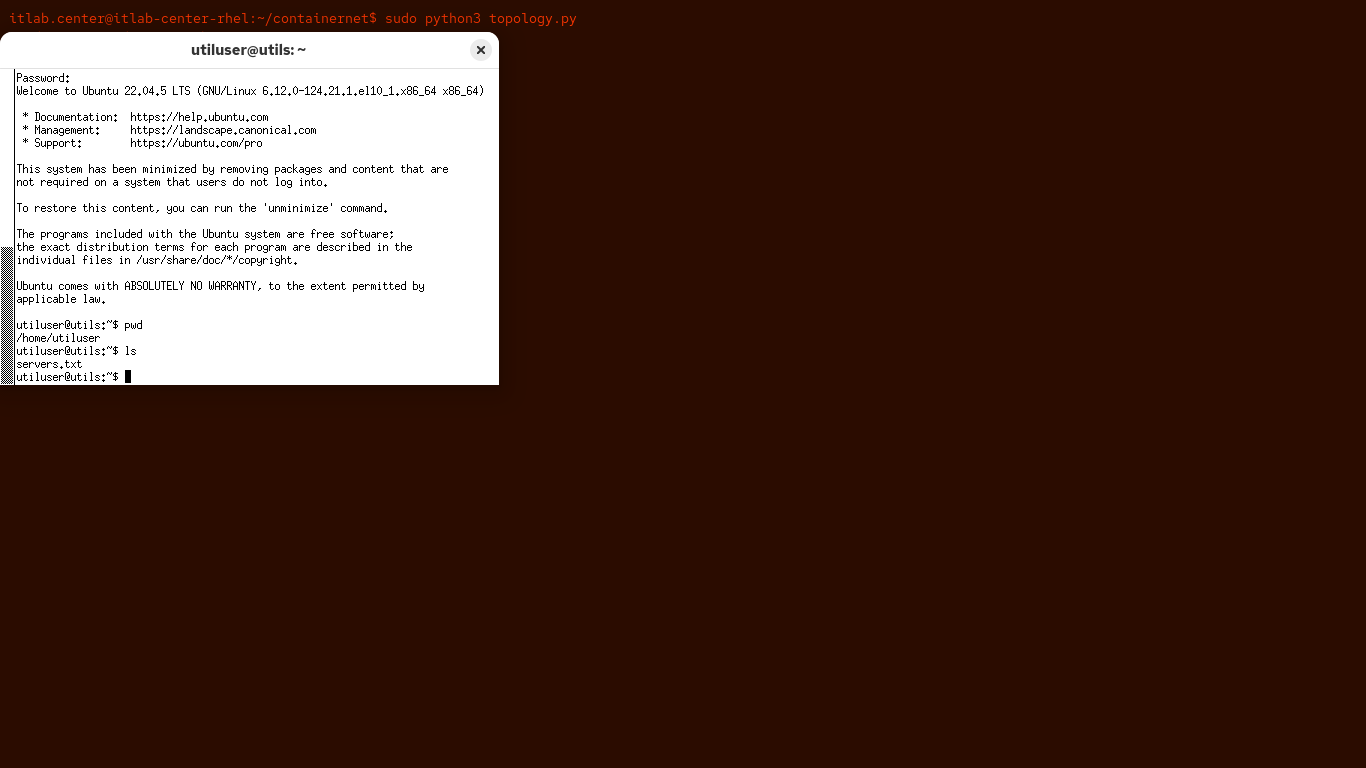
Run the following commands from the Telnet Utilserver Connection to print working directory and contents:
utiluser@utils:~$ pwd
utiluser@utils:~$ ls
Resulting Output:
Run the following command from the Telnet Utilserver Connection to display the contents of servers.txt:
utiluser@utils:~$ cat servers.txt
Resulting Output:
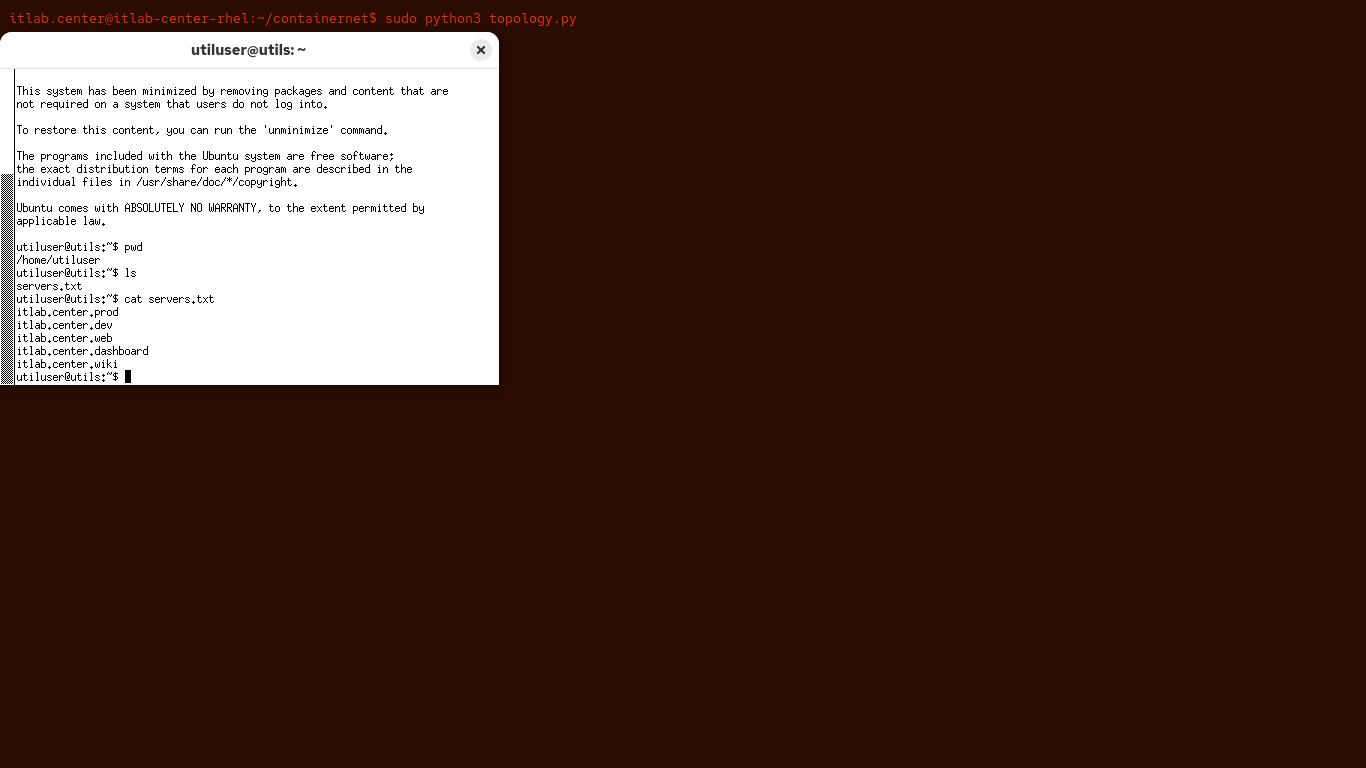
Great stuff. No need to bring that with you, Wireshark will remember the details, so type exit and enter
Let's do that one more time, but just a quick log-in and exit to provide fodder traffic for our exercise
Run the following commands from the Workstation Nodes Xterm Terminal and provide authentication as needed:
root@ws:/# telnet utilserver
utiluser@utils:~$ exit
In the next steps, you will generate some web traffic, your windows to the wide & wondrous digital world
Run the following command from the Workstation Nodes Xterm Terminal to open the firefox web browser:
root@ws:/# firefox&
This may take upwards of 30 seconds. You can disregard any warnings that may appear in the terminal window
In the browser location bar, type http://webserver.com and press enter to head to the networks web server:
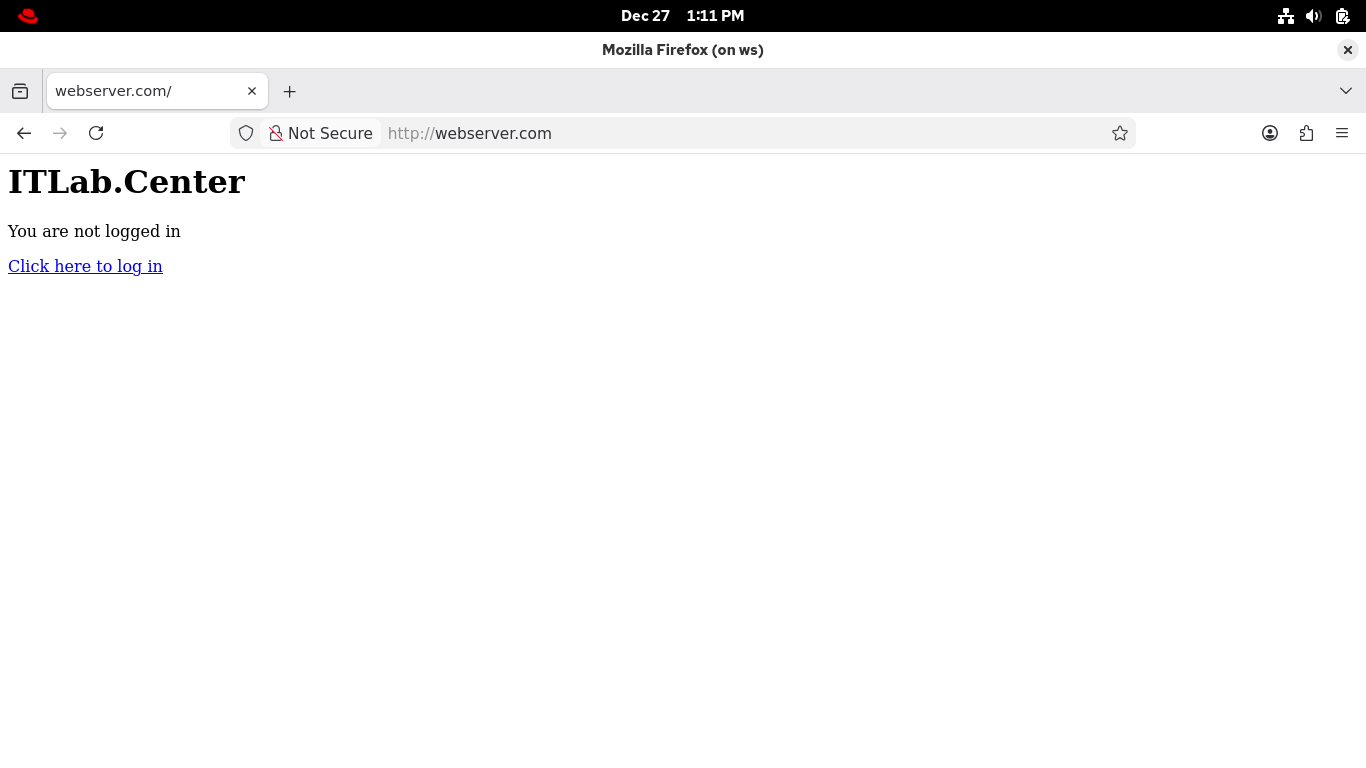
Enter the following credentials in their corresponding fields: Username: webuser, Password: password123
Click Login, you'll notice that a file has been downloaded called ComputerClean.elf, that can't be good:
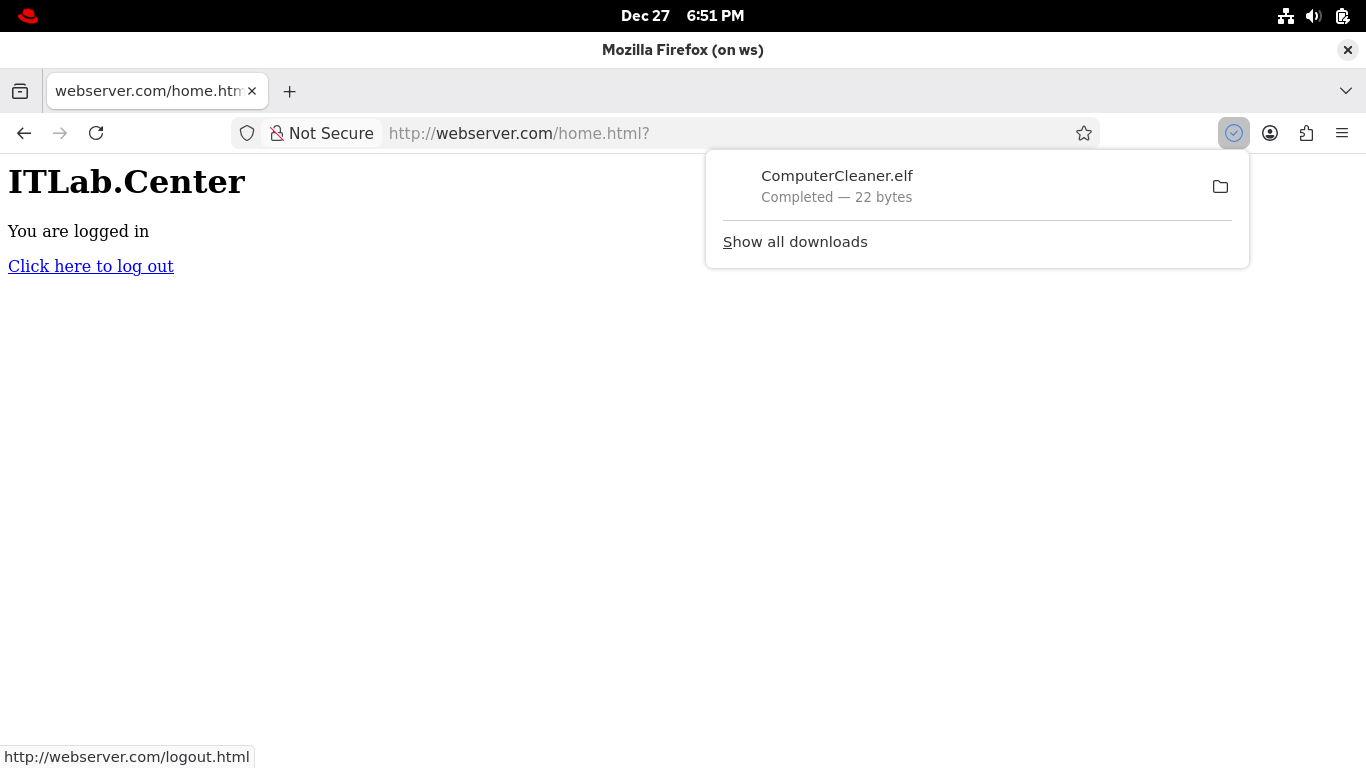
Unfortunately, you can't check it out because the file was immediately deleted, a case of panic delete
But don't worry, our Wireshark capture will pick that download up even though the user deleted the file
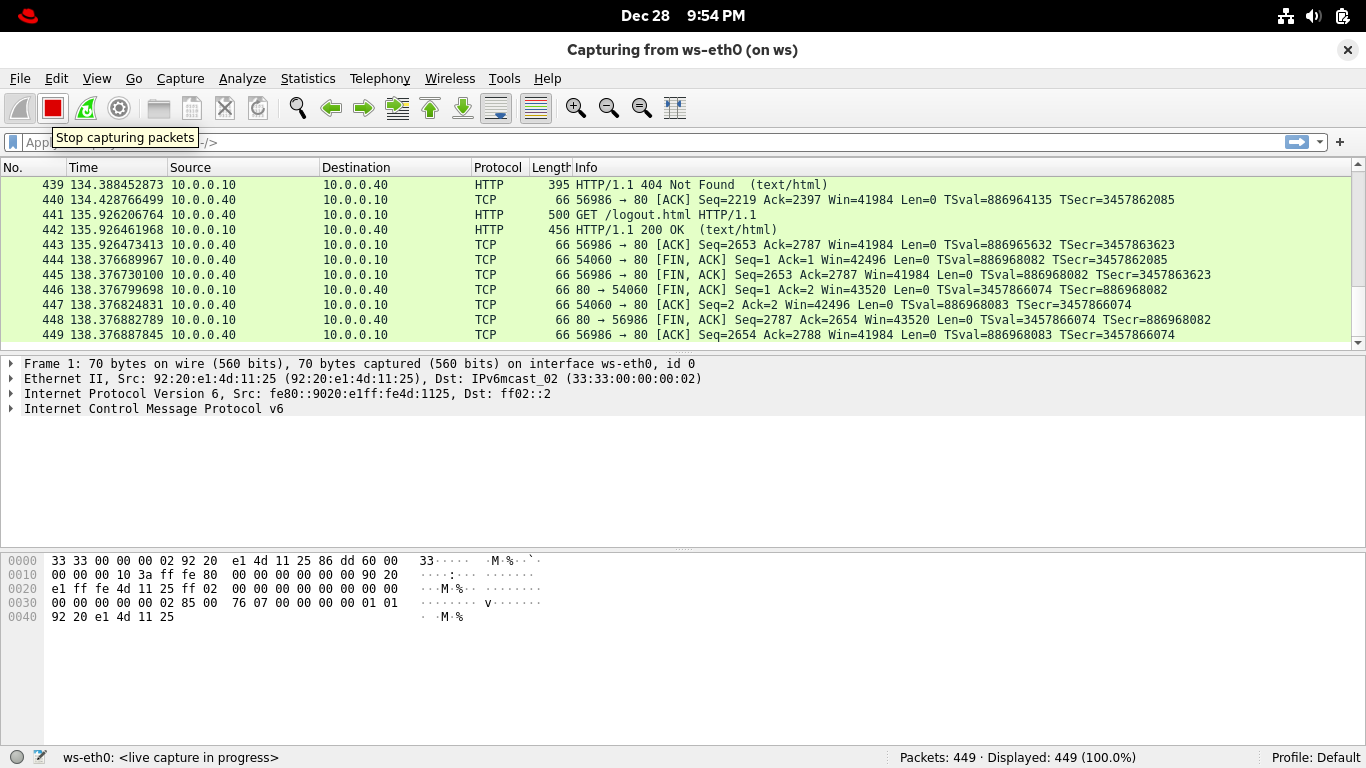
Let's go ahead and log out now, we have captured plenty of traffic in Wireshark for our packet analysis
Go ahead and click the 'Click here to log out' link within firefox, then you can close out of the browser
Reopen the Wireshark window, then on the toolbar, click the red square icon to stop your packet capture:
From the Wireshark menu, select File > Save As... to save your capture, you can name it however you like
8. Analyze Network Traffic
Analysis is usually conducted after the fact, such as a SOC Analyst investigating an alert created by IDS
The computer whiz depicted in hollywood, lines of code racing across their screen, are just waiting for
their programs executions to complete so that they can perform the real work by consulting the log files
Wait until you've captured a full transcription of the network activity, then you can review it on demand
From the Wireshark applications display filter bar, type in icmp to filter for packets of network pings:
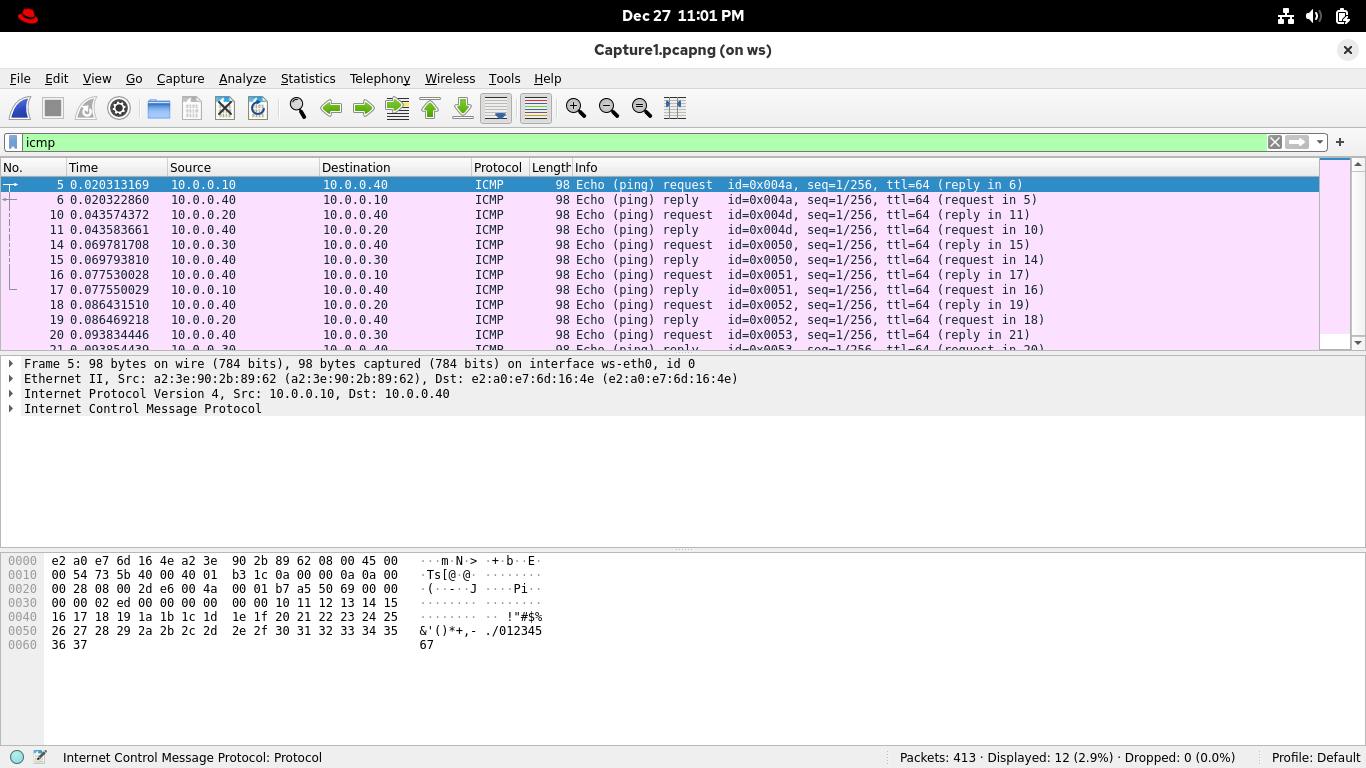
ICMP is the protocol that ping speaks, so this filter is showing that radical ping party you had earlier
You can also use some common logical operators in the filter expressions to include multiple traffic types
From the Wireshark applications display filter bar, change the filter expression to icmp or arp and enter:
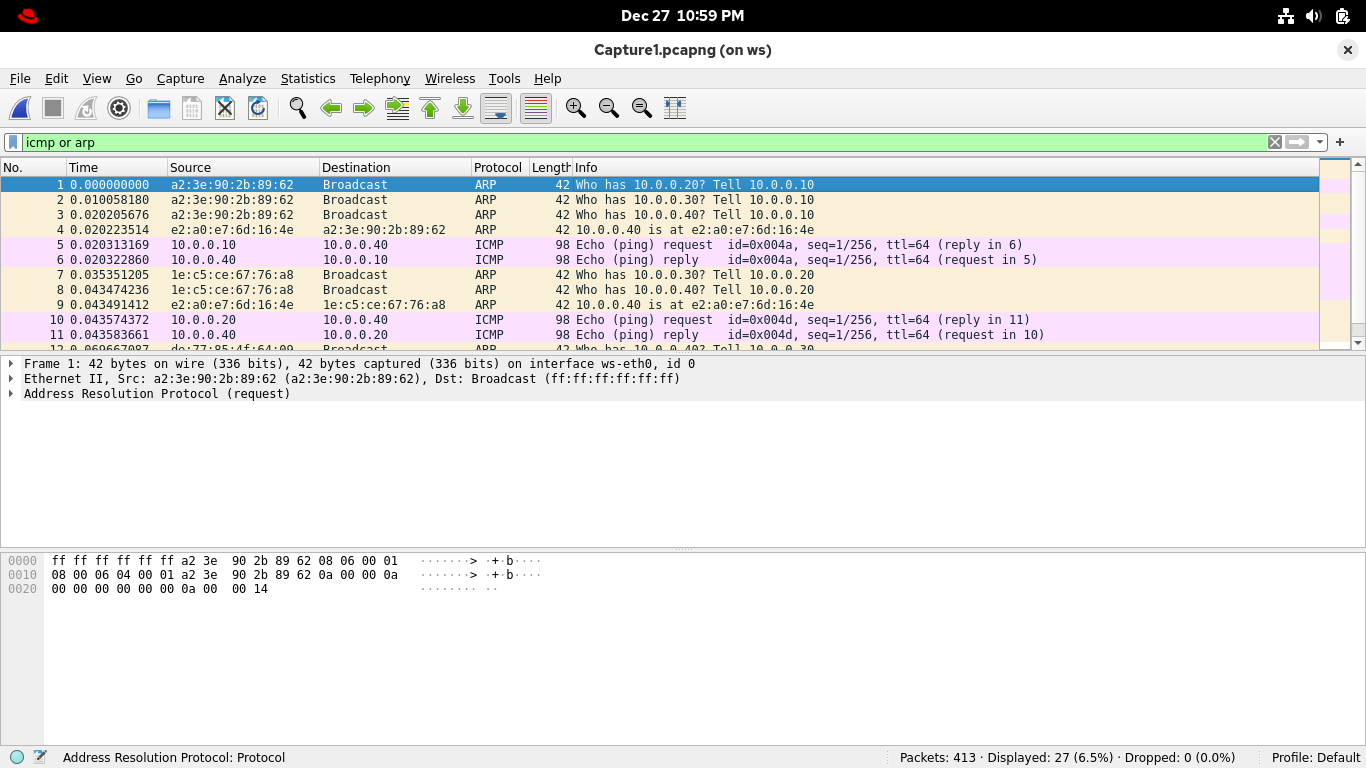
ARP is a way of discovering the MAC address of a host with a given IP, which is needed for packet delivery
Because of this you should only ARP traffic for hosts on your local network, where MAC addresses are needed
Meanwhile, the Internet Message Control Protocol (ICMP) can show delivery to multiple different networks
Looking at ARP traffic is a great way to discover all live hosts on a network topology. Close analysis of
these packets can lead to discoveries of nefarious behaviors such as MAC spoofing, and NAC and MITM attacks
From the Wireshark applications display filter bar, set the filter expression to telnet for remote access:
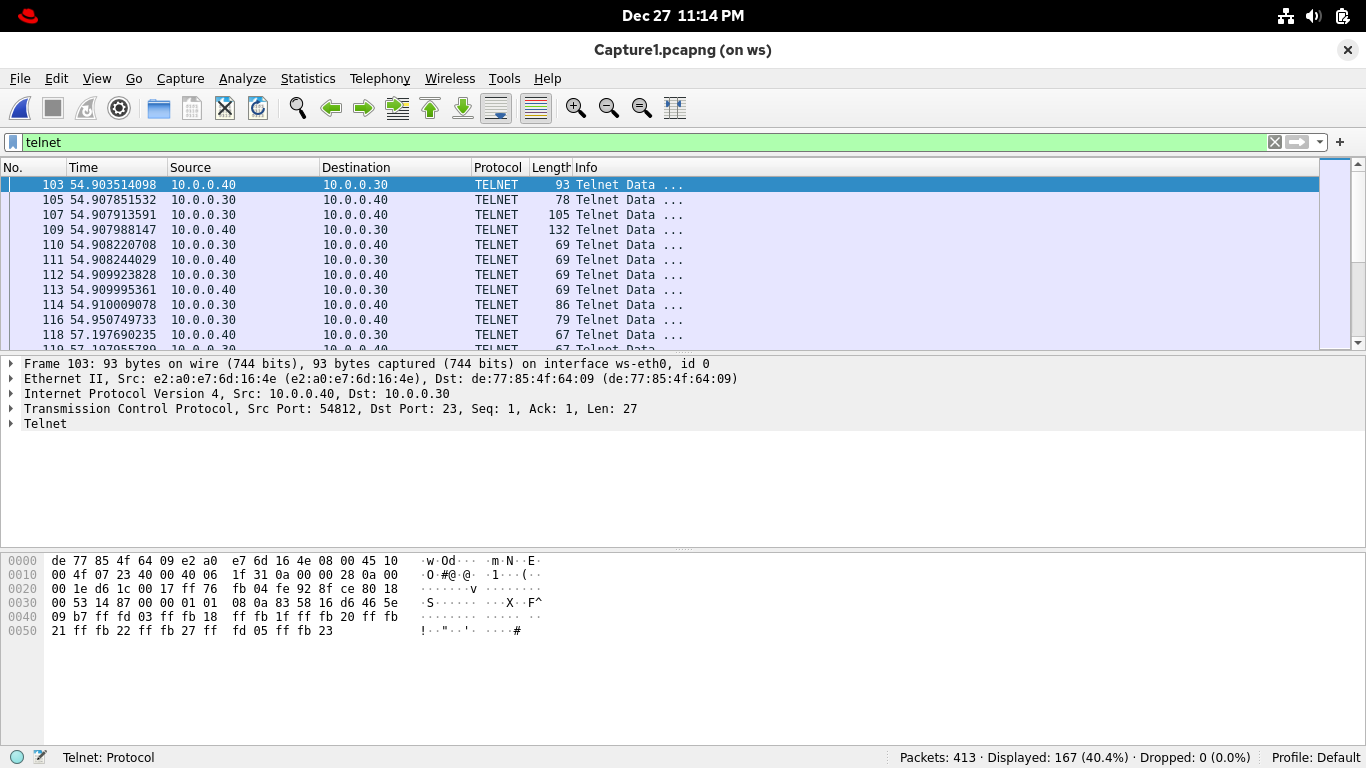
Remember that you had two telnet sessions here. Can you tell which is which? Wireshark can, using Streams
You could filter for streams by entering an expression into the filter bar, but Wireshark makes it easier
In the Packet List pane, right-click on the first packet in the list, then select Follow > TCP Stream:
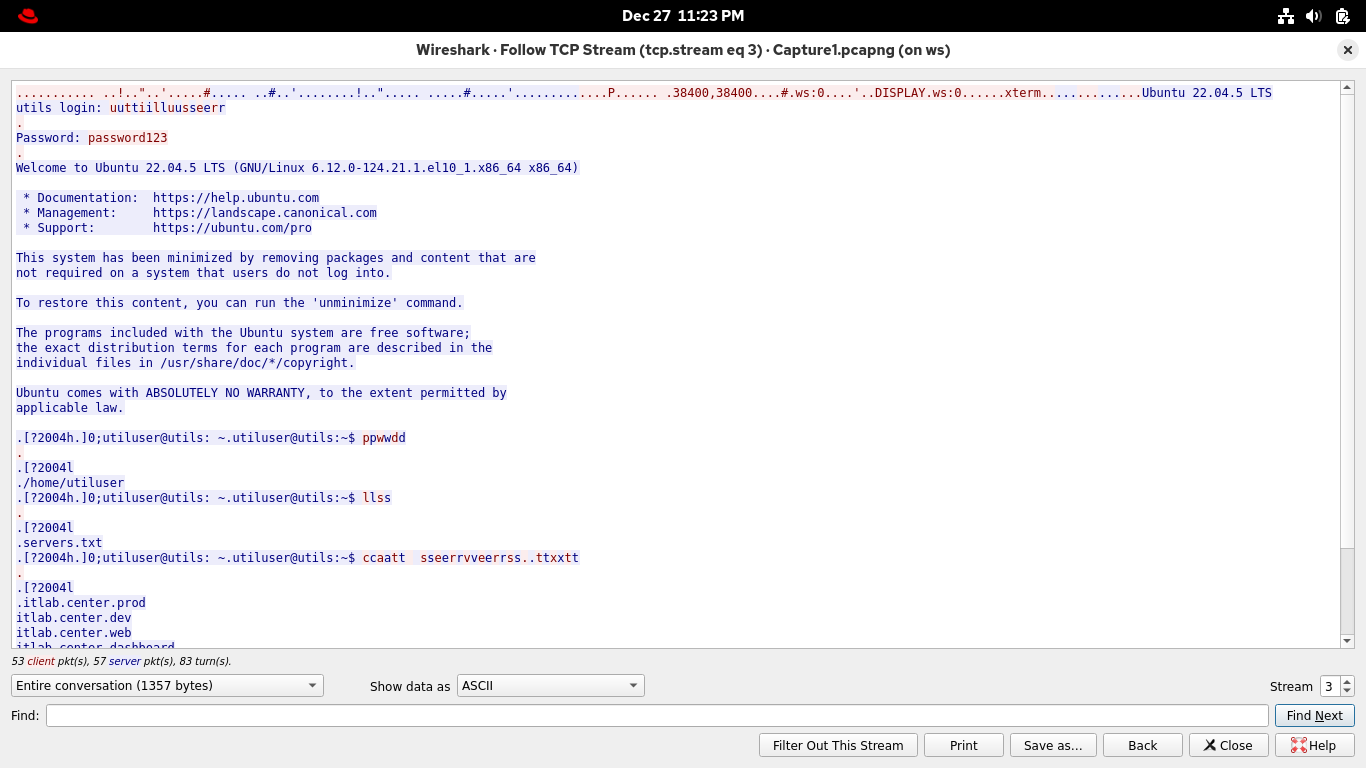
Fantastic, we are looking at a full record of that initial exchange the workstation had with utilserver
Wireshark colors client transmissions in red and server transmissions in blue to make it easy to follow
Here you can see the credentials you used to log in, the commands you ran, and the contents of servers.txt
You will also notice that each letter you input into the terminal was echoed by the server showing twice
Streams let you to view specific sessions by looking at information like source and destination addresses
They also look at the flags set in the packet that indicate the beginning (SYN) and end (FIN) of a session
You should see Wireshark has colored these SYN and FIN packets as a visual aid for demarcating the stream
Close the Follow TCP Stream window, you will notice fewer telnet packets as they are excluded by session
From the Wireshark applications display filter bar, click the X icon to remove the current applied filter
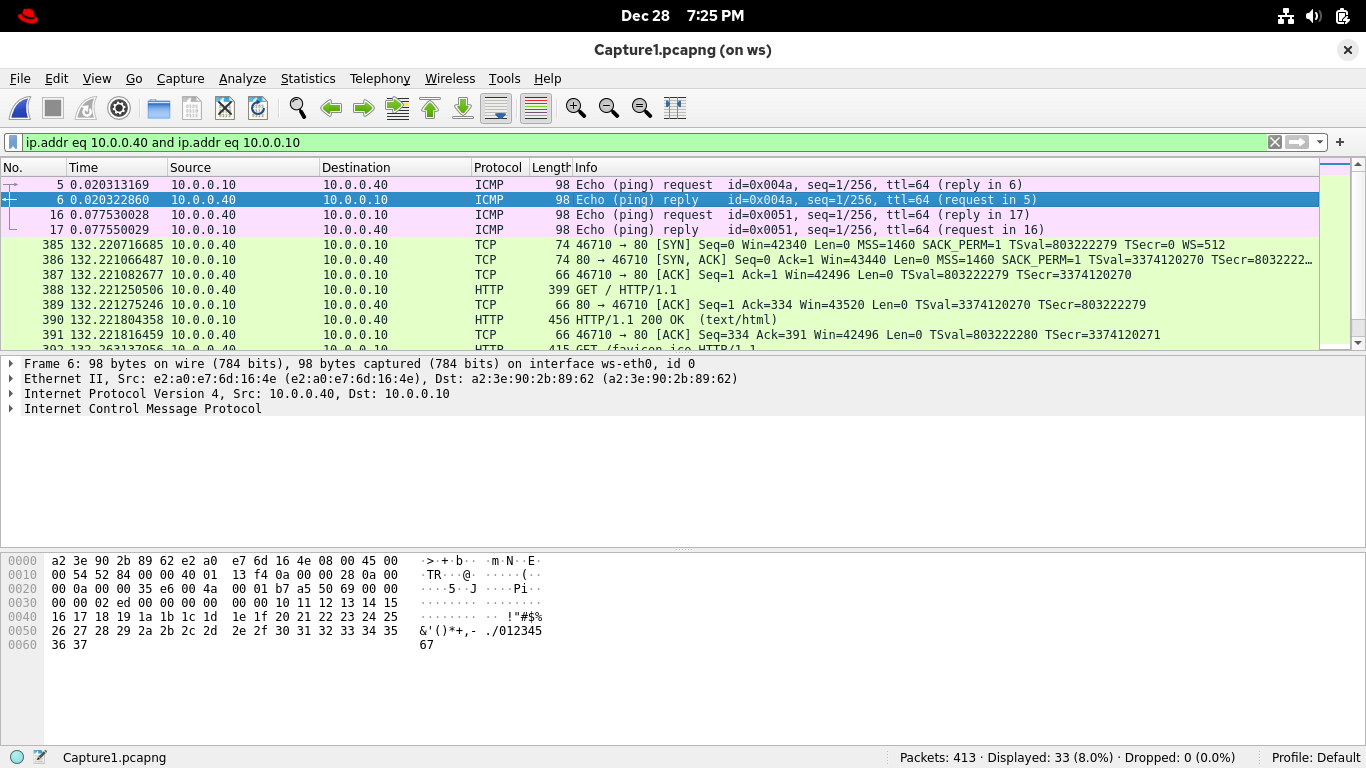
Select any packet with 10.0.0.40 (workstation) as the Source and 10.0.0.10 (web server) as the Destination
Right-click on the selected packet and select Conversation Filter > IPv4 from Wiresharks context panel:
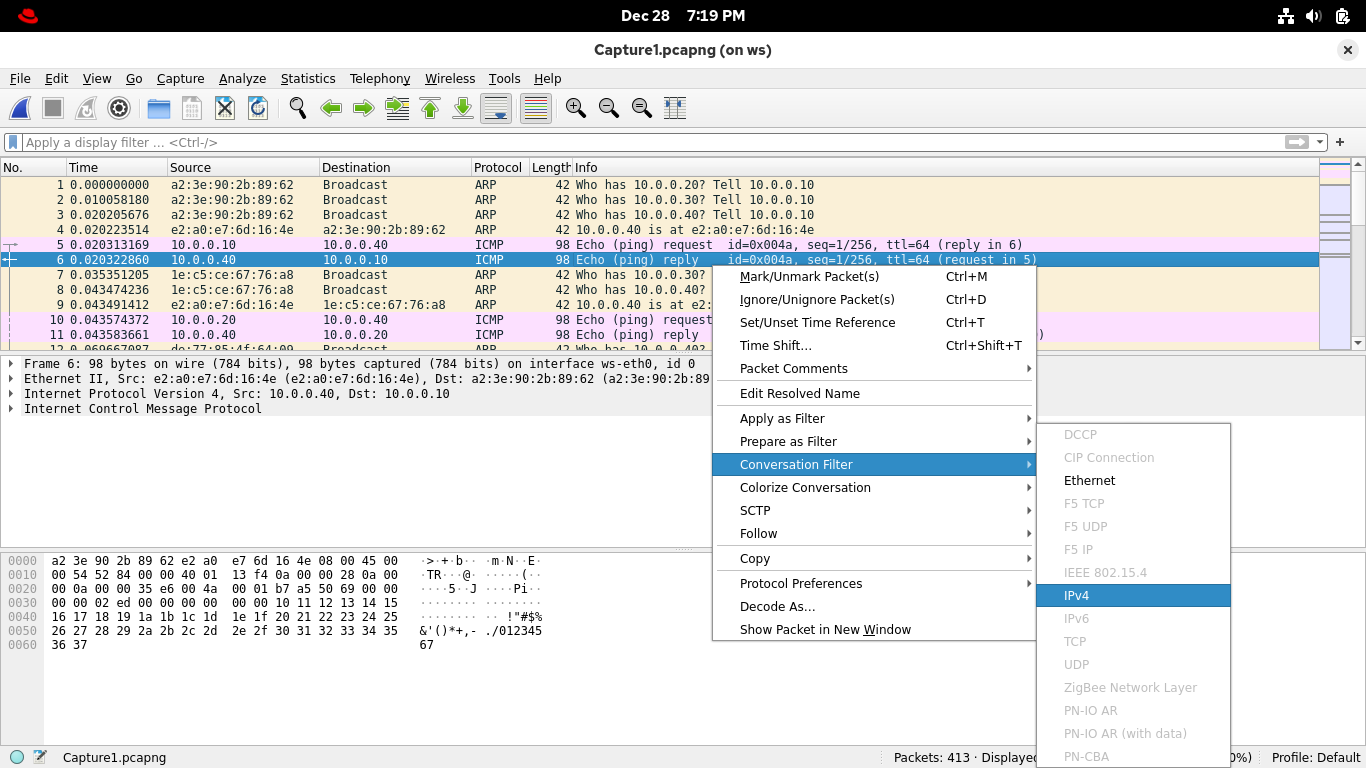
Wireshark applied a display filter which groups packets representing the transfer between these endpoints
As you can see, conversations perform these groupings to give context regardless of sessions or protocols:
Some protocols are connection-less, so they don't use SYN and FIN flags to start and end their sessions
In those cases, it is useful to begin with a Conversation, and the filter the display to the set protocol
One example is HTTP, from the display filter bar, add "and http" to the end of the current filter, enter:
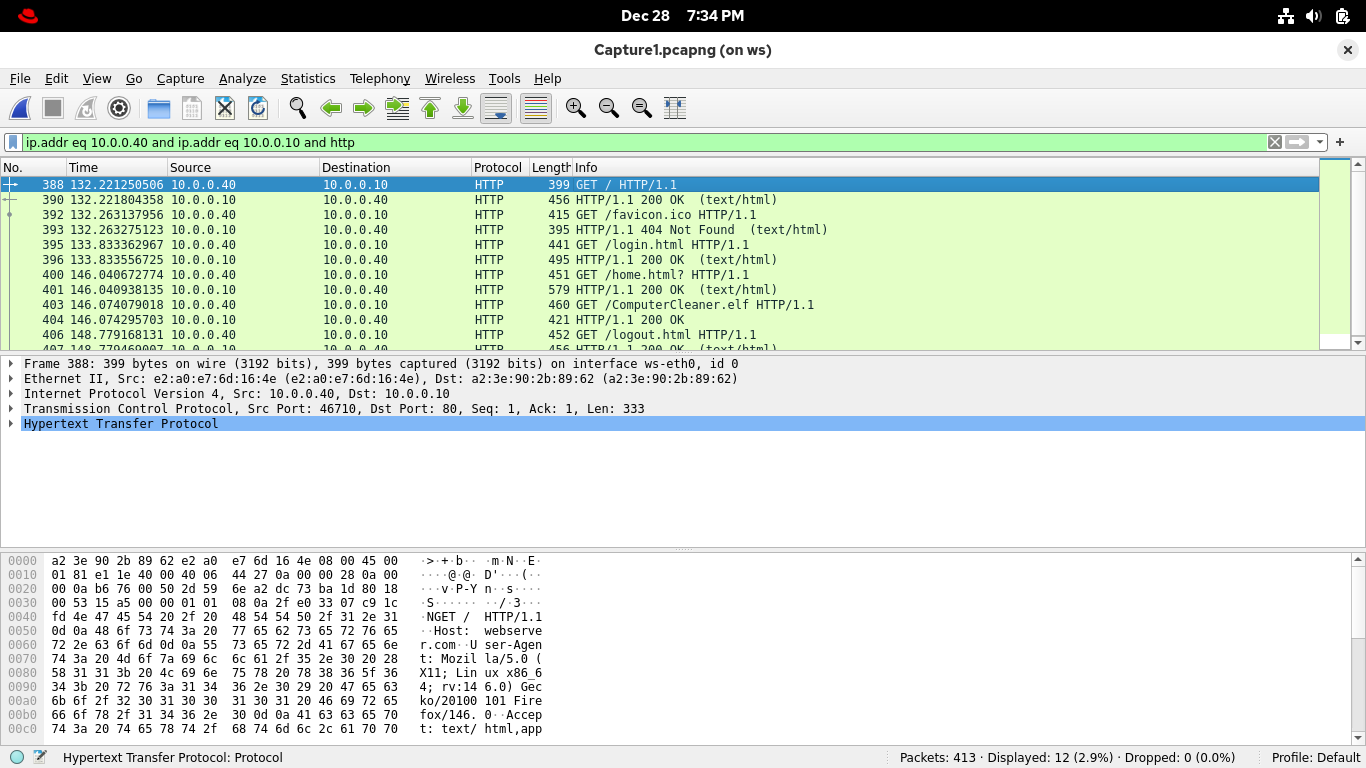
This shows any HTTP traffic exchanged by the two hosts in this conversation, find one from among this list
Select and right-click any HTTP packet, then select Follow > HTTP Stream from Wiresharks context panel:
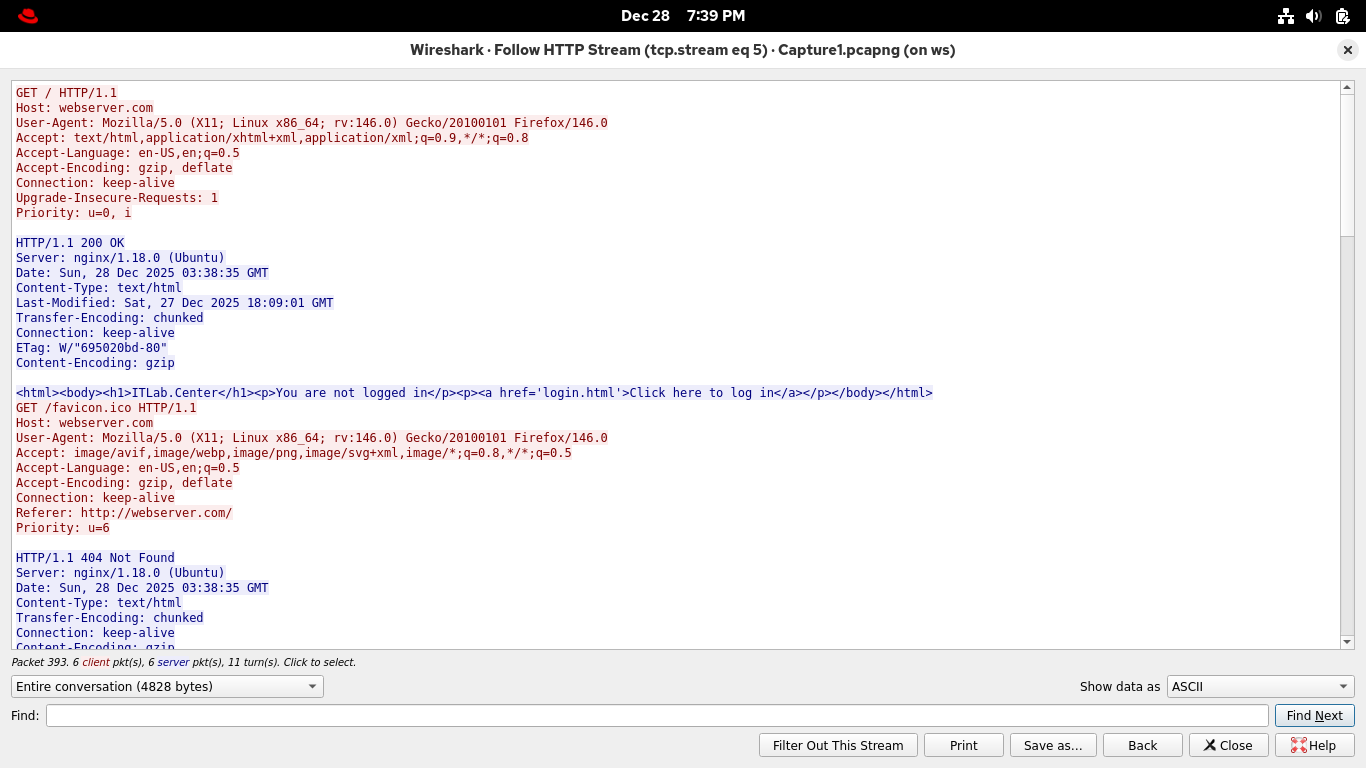
Each request for a website is met with a response, and that's the extent of HTTP in the Wireshark stream
A total of one exchange, as we said, connection-less, it is however useful to get the exchange in view
Remember that the client request is red, and the server is blue, we can see the web server type is NGINX
You can close the Follow HTTP Stream Window. Next, you will try out some of the HTTP filters in Wireshark
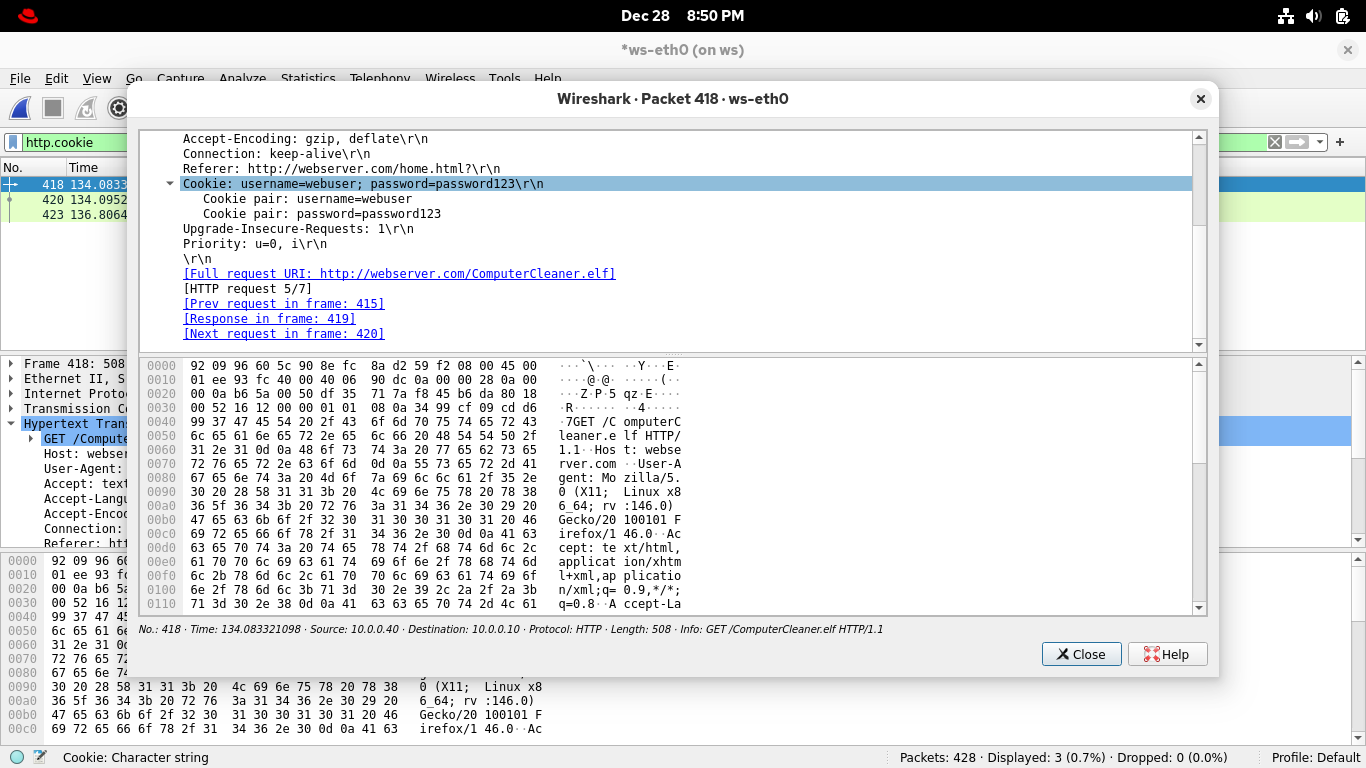
From the Wireshark applications display filter bar, set the filter expression to http.cookie for cookies:
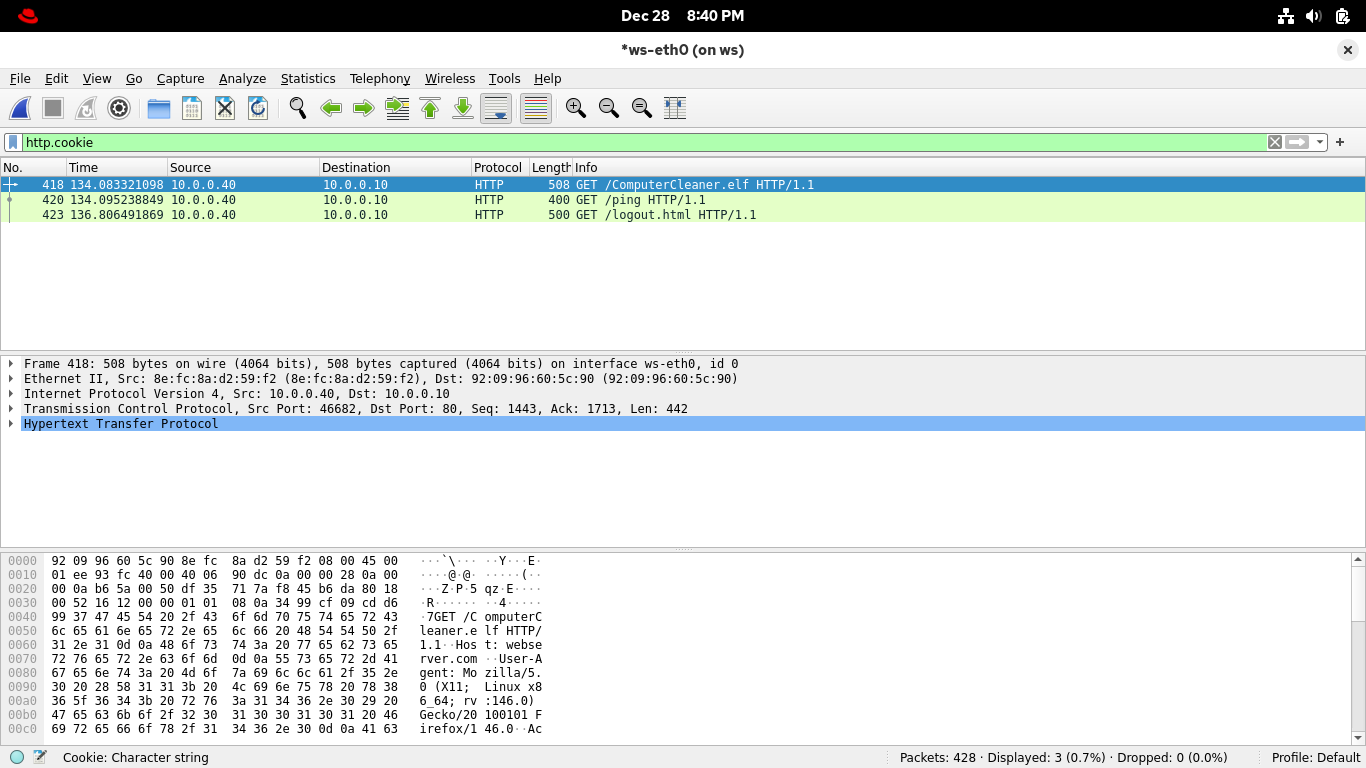
Here are all the packets that contain the HTTP cookies, one of which contains the HTTP session identifier
You can find the cookie by expanding the Hypertext Transfer Protocol line for each of the captured packets
You can also double-click on a packet to reveal its contents in a dedicated window, check out some of them
Speaking of unwelcome injections, didn't that site push a file download to your computer that was deleted?
No problem, Wireshark lets you reconstitute this file from the packet data since it captured it over wire
From the Wireshark application, select File > Export Objects > HTTP to open the Export dialog menu box:
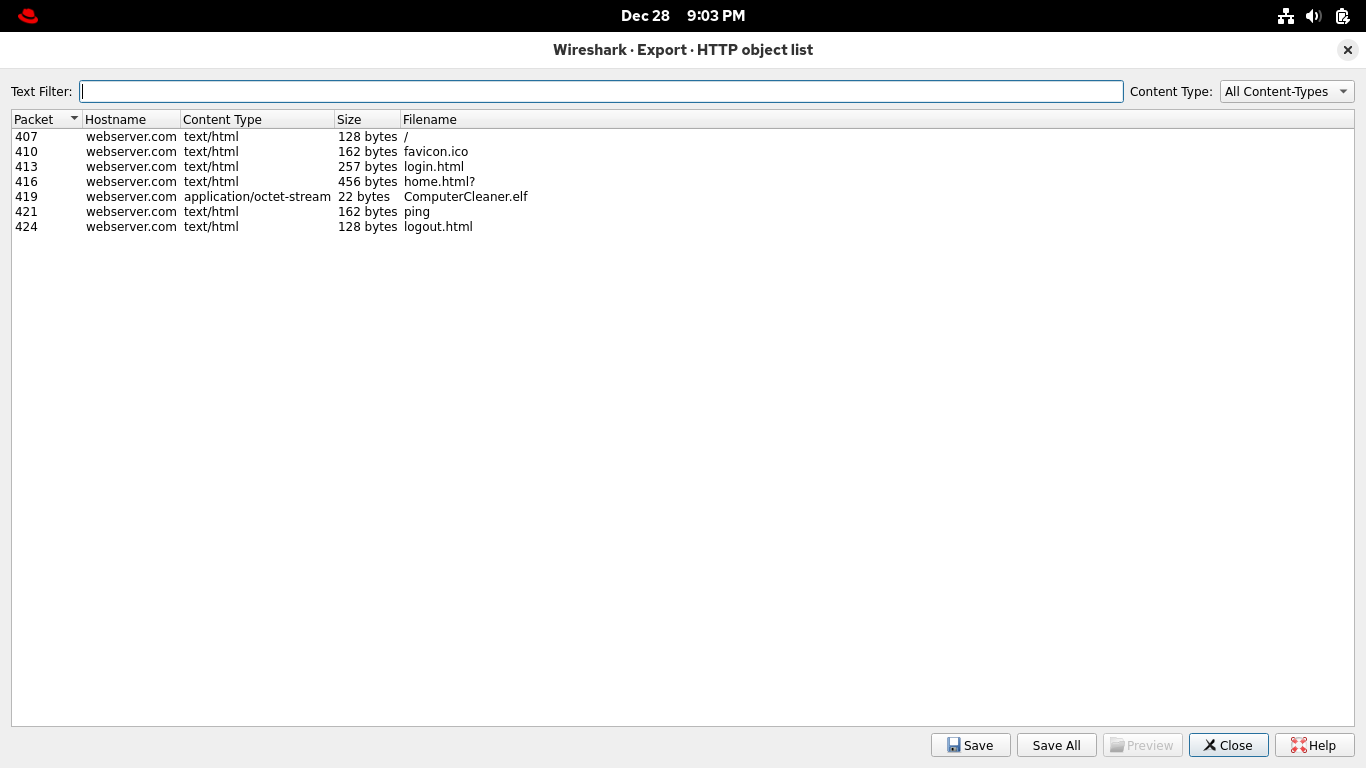
No filter required, this view shows a list of data objects transferred with HTTP, save ComputerCleaner.elf
Run the following commands from the Workstation Nodes Xterm Terminal to check out that file you downloaded:
root@ws:/# ls
root@ws:/# cat ComputerCleaner.elf
Resulting Output:
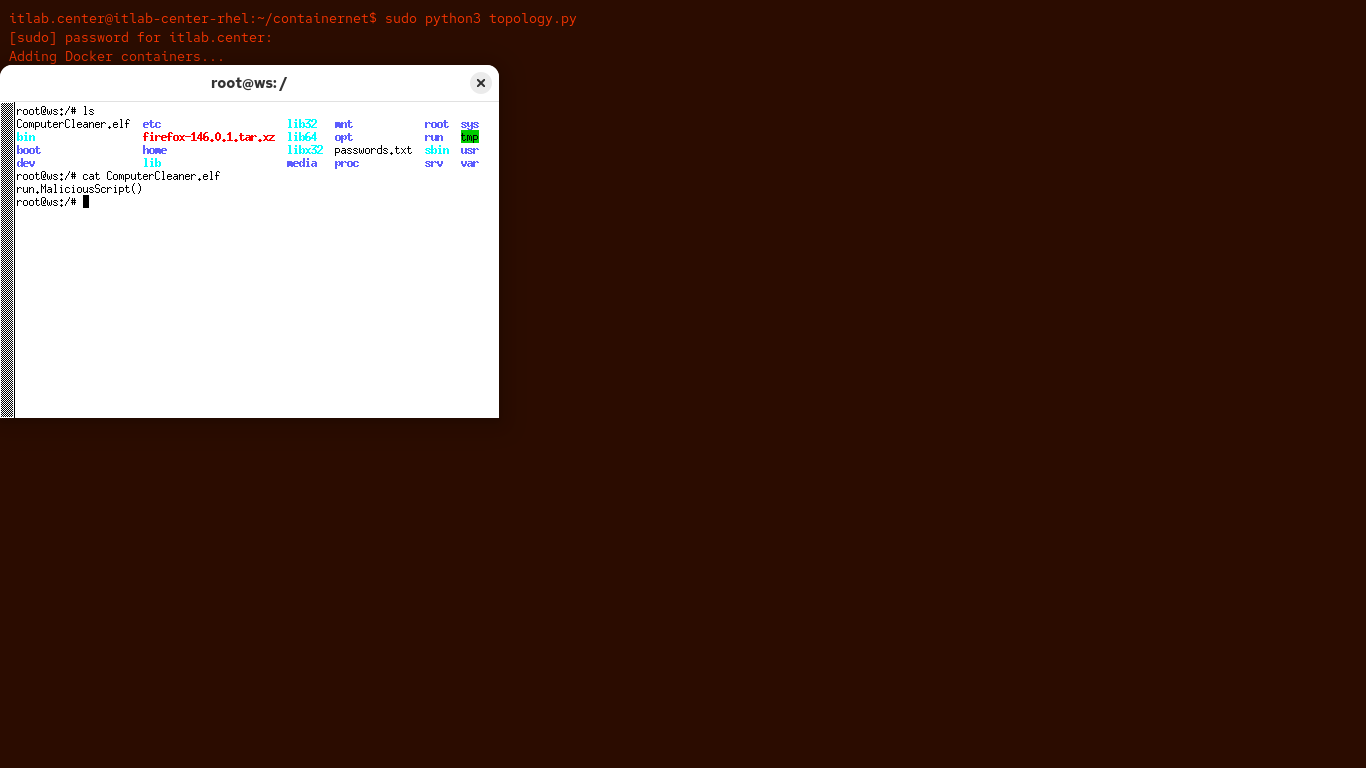
Naughty user, we can clearly see why they deleted this, but they can't hide anything from the Wireshark
Final step in this lab it is time to review your file transfer, return to Wireshark and close the export
From the Wireshark applications display filter bar, set the filter expression to ftp for file transfers:
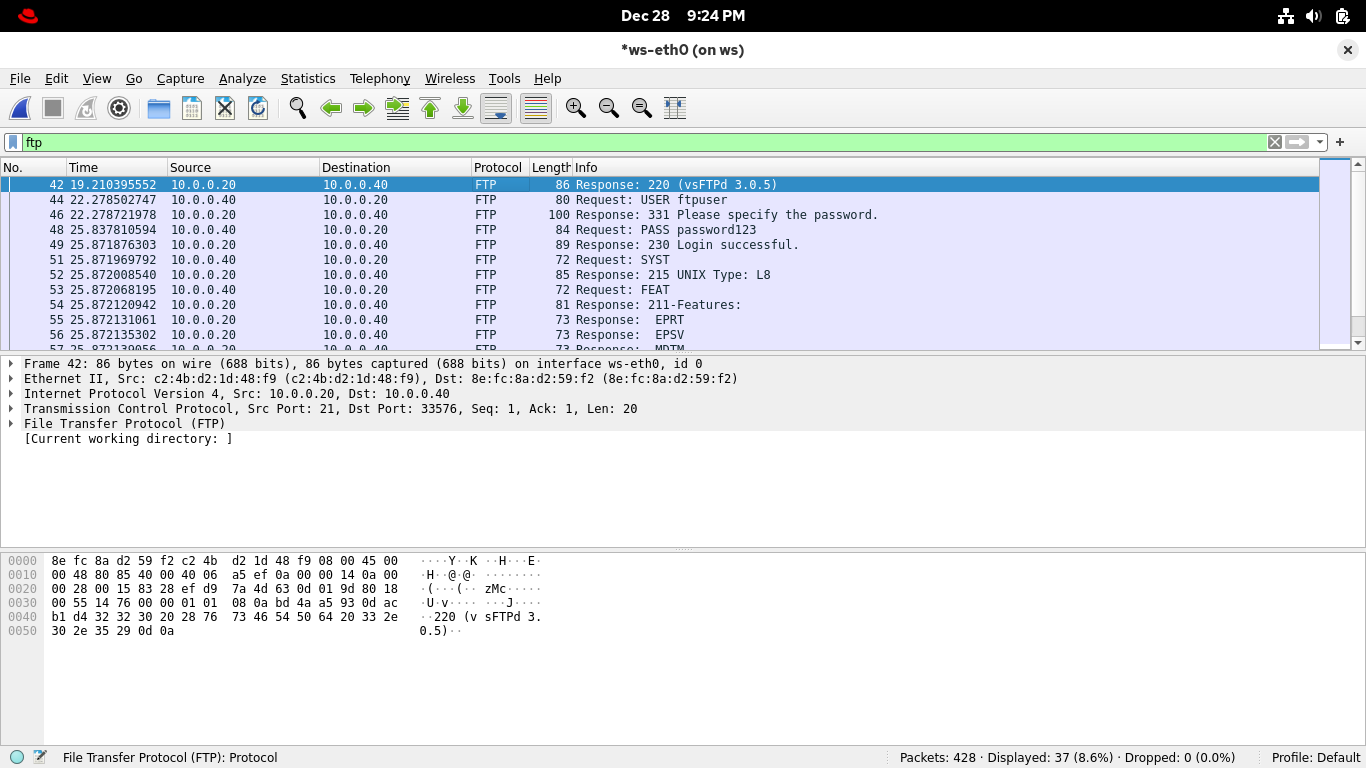
Select and right-click any of the packets and select Follow > TCP Stream from Wiresharks context display:
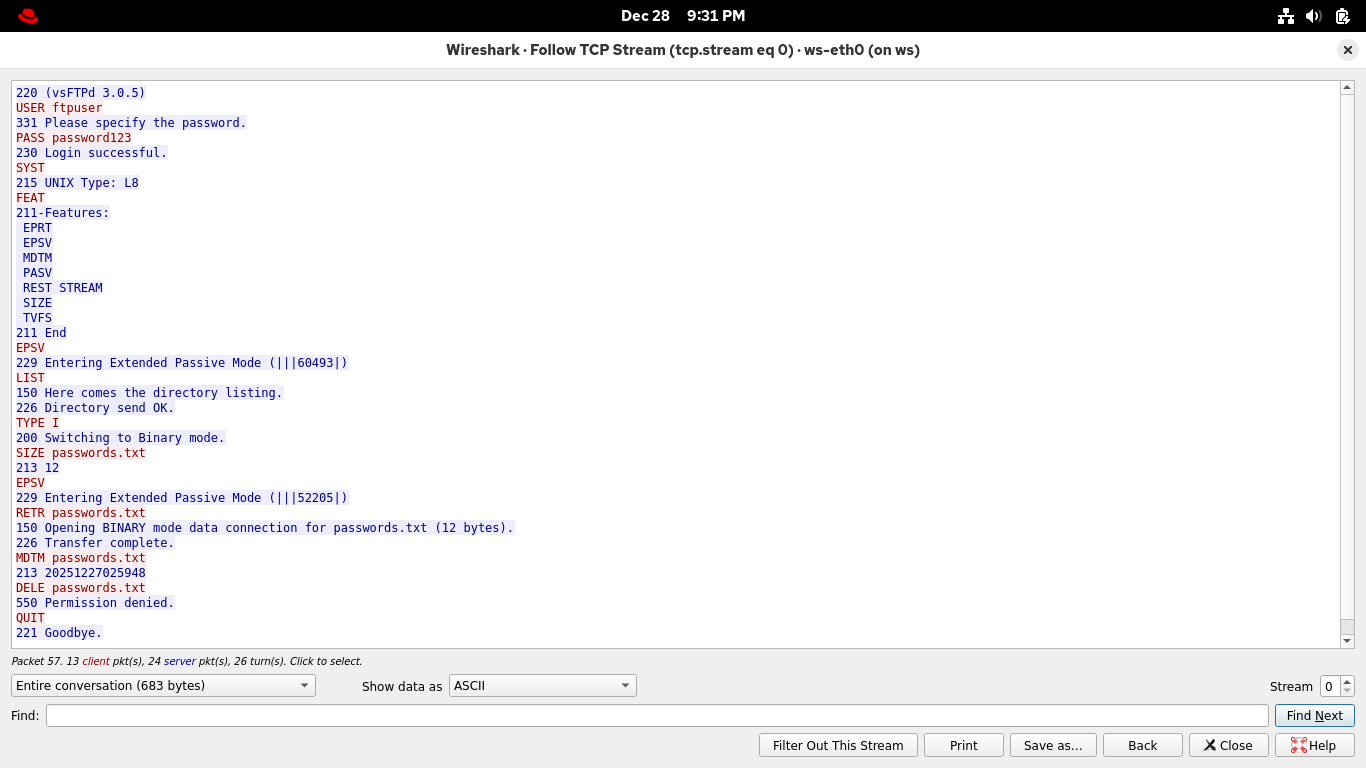
As before, the full exchange is recounted in red and blue transmissions representing client and server
A neat ledger that contains the username and password in cleartext, as well as the files we transferred
But what about the file contents? You can see that too, you just need a different filter for ftp data
From the Wireshark applications display filter bar, set filter expression to ftp-data for file contents
Select and right-click the packet that lists passwords.txt in the info column, then Follow > TCP Stream:
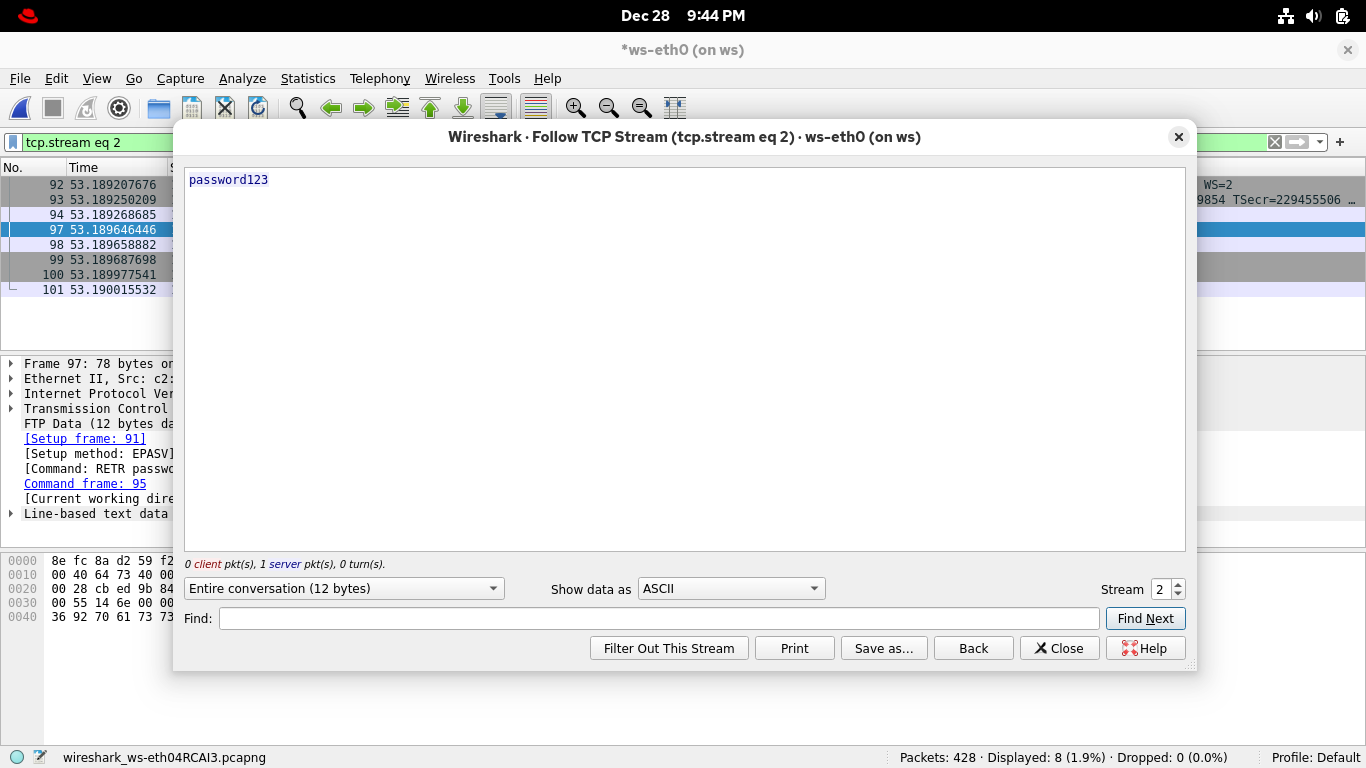
Bingo! Congratulations, this marks the end of our lab exercise with the powerful packet inspection tool
This is a major milestone and proves hands-on experience with Wireshark, Docker, Containernet, and Python
Those were just the main tools as well, also involved was nginx, vsftpd, telnet, RHEL, ubuntu and HTML